Trial Innovation Network Series
2019-11-04
Reproducible Statistical Reports
Reproducible Analysis/Reports
- The code is the ultimate documentation of how data analysis was done
- Need to be able to regenerate an entire analysis and report with a single command
- Allows others to reproduce your work
- Allows you to easily re-run analyses upon data corrections/updates or changes in statistical analysis
- Team work and personnel changes
- Journals starting to require code
Interactive Graphics
Full Interactivity
- Requires statistical software to be run, i.e., report not self-contained and useable offline. Think
RShiny - E.g. change the bandwidth and re-run a nonparametric smoother for trend; selection of variables to include in a model
Partial interactivity
- Zoom, pan
- Rescale axes
- Extra information pop-up (hover text)
- Select which traces to show
- Instead of having legends and explanations (e.g., for box plots) show extra information as hover text
R Software: plotly Package
- Implementation of
javascript D3graphics modelplotly - Best developed partially interactive scientific graphics for R
- Has it’s own model, or:
ggplotlyfunction: pass anyggplot2graphics object through it to get interactivity
New plotly Graphics Functions in Hmisc and rms Packages
Examples Using Mayo Clinic pbc Dataset
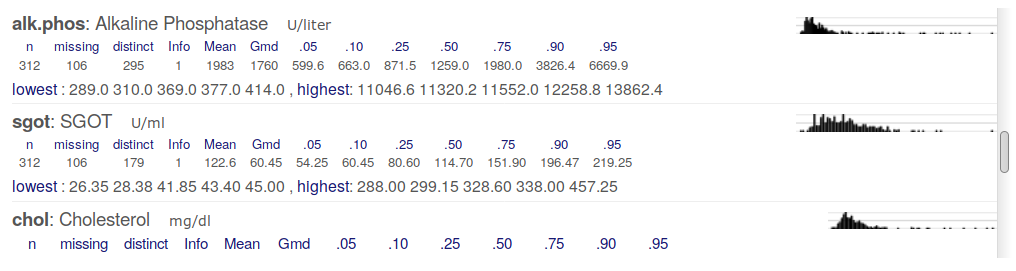
Hmisc::describe: Tabular Output
describe: Categorical Variables
p <- plot(d); p$Categorical
Continuous Variables
p$Continuous
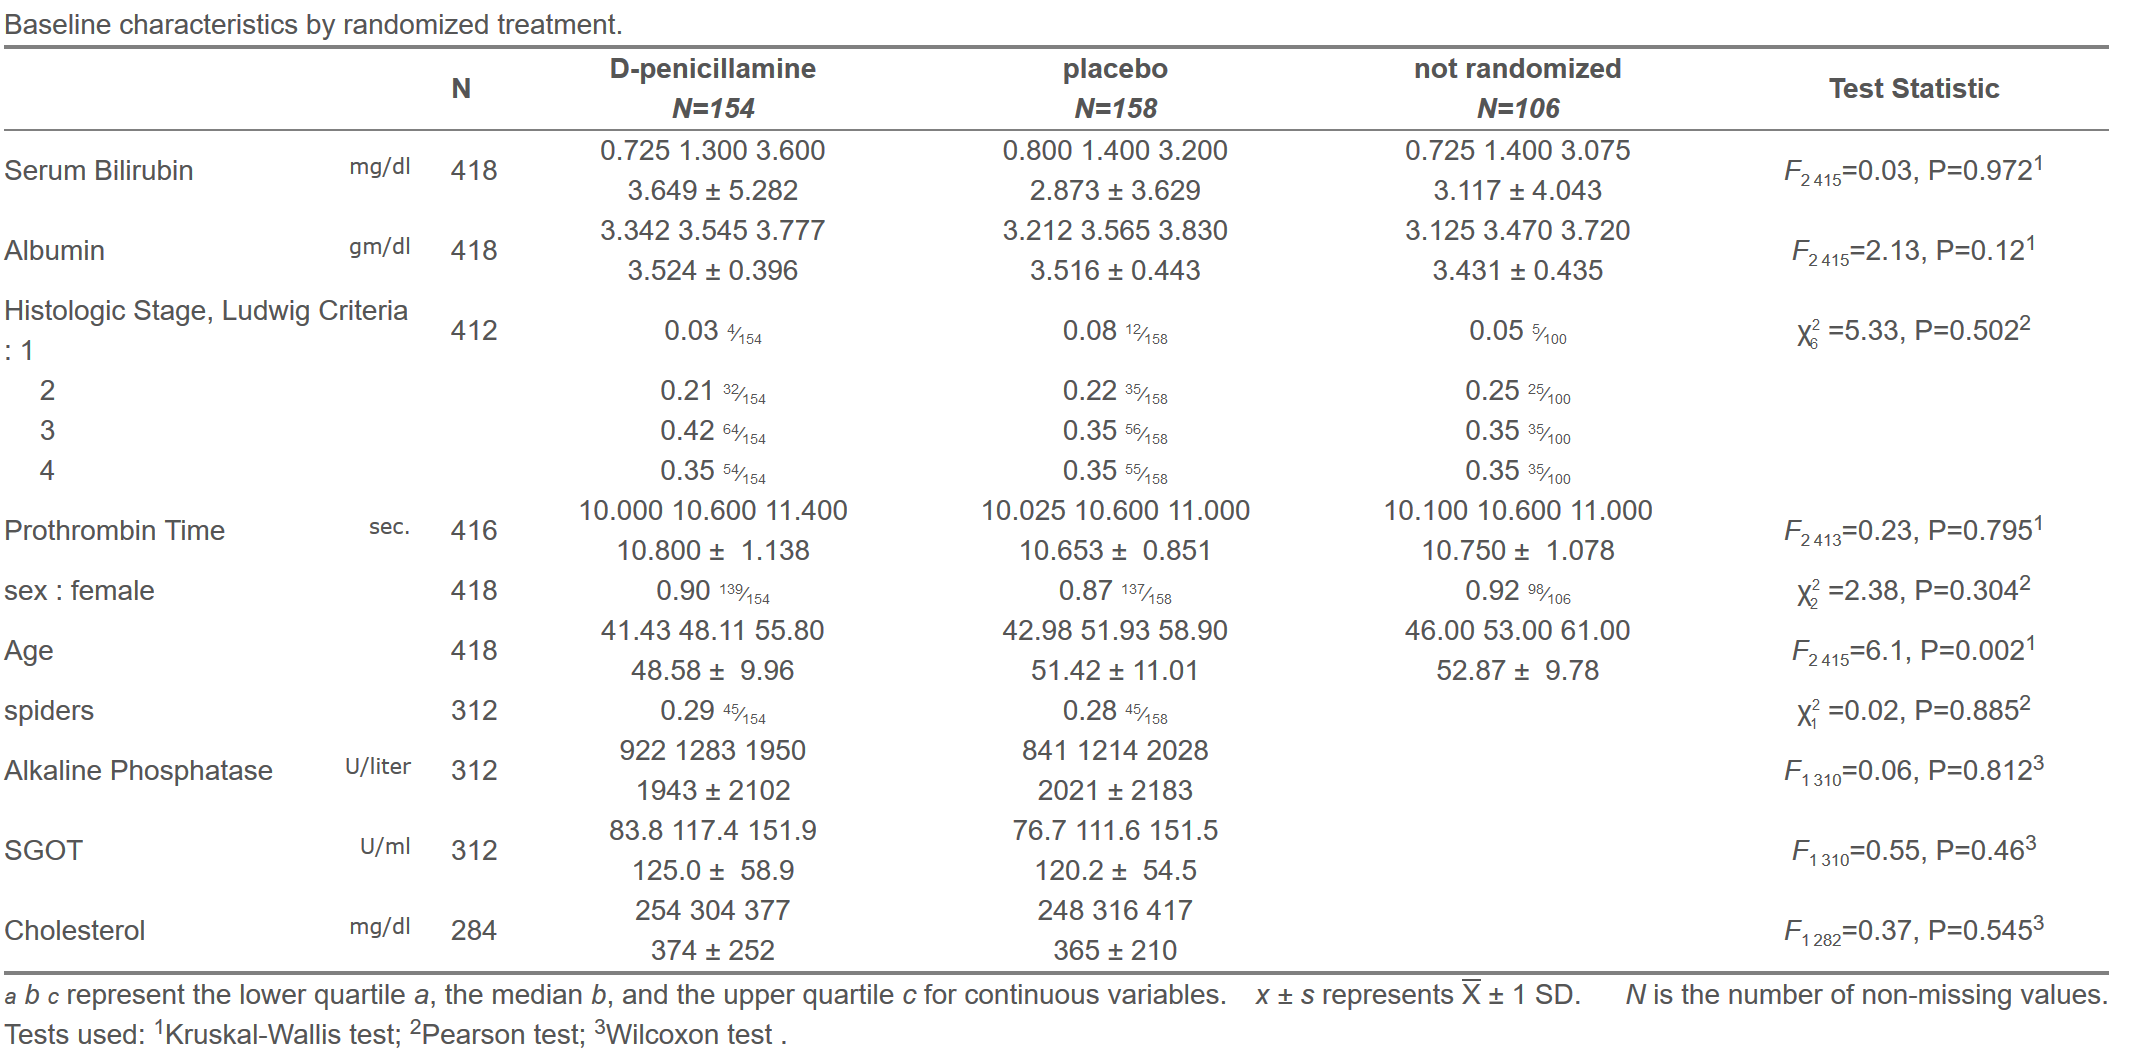
Hmisc::summaryM to Stratify by drug
s <- summaryM(bili + albumin + stage + protime + sex + age + spiders +
              alk.phos + sgot + chol ~ drug, data=pbc,
                            overall=FALSE, test=TRUE)
Plots for Categorical Variables
plot(s, which='categorical')
Plots for Continuous Variable
plot(s, which='continuous', vars=1 : 4)
Spike Histograms, Not Dot or Box Plots
- Show data in almost full resolution using 100 or 200 bins
- Hovertext to see location and count
- Overall statistical summary by hovering over leftmost part
- Can see bimodality, digit preference, …
- SD and (better) Gini’s mean difference aligned to origin
- Intervals under histogram shows quantiles
Hmisc::histboxp on support2 Dataset
getHdata(support2)
with(support2, {
    units(meanbp) <- 'mmHg'
    histboxp(x=meanbp, group=dzgroup, sd=TRUE, bins=200)
} )
rms::survplotp
require(rms)
f <- npsurv(Surv(fu.yrs, status) ~ spiders, data=pbc)
survplotp(f, time.inc=1, times=c(5, 10), fun=function(y) 1 - y)
Advanced HTML Tables Using htmlTable and Hmisc Packages
html(s, caption='Baseline characteristics by randomized treatment',
     exclude1=TRUE, npct='both', digits=3,
     prmsd=TRUE, brmsd=TRUE, msdsize=mu$smaller2)
Clinical Trial Reports
High-Level Abstractions
- Foster good statistical analysis, graphics, reporting practice
- Minimize programming for individual clinical trials
- Reviewers are tired of tables and reports having 100s of pages
- Clinical trial reports have many standard components
Some Standard RCT Report Components
- accrual summary
- patient flow/exclusions
- baseline description
- longitudinal analyses
- adverse events
- lab safety parameters (blood, ekg, etc.)
- event timing/incidence
- sequential monitoring of event probabilities
RCT Report Philosophy
- Tables do not lead to pattern recognition
- Graphics > tables when >2 numbers in the table
- Graphics should use features humans most accurately perceive
- position along a common scale
- Need for signposts on graphics
- Tables are secondary; should be in appendix and hyperlinked
- or as hovertext from a plot
Philosophy, continued
- Emphasize confidence intervals for differences
- Show entire distributions when possible
- Favor quantiles over moments
- Percentages are inherently confusing
- replace with proportions and ratios
R Packages greport and hreport
- Utility functions
- High-level report component functions
- Unified handling of figure generation, captions
- New graphical elements
Graphical Elements
- Extended box plots
- Special dot charts for stratified proportions
- Half-violin plots (vertical density plots)
- Half-confidence intervals
- centered at midpoint of two estimates
- length = ½ length of CL
- → touches the 2 estimates ↔ difference not “significant” at α=0.05
- Spike thermometers as signposts
High-Level Functions
- accrualReport: subject accrual, accounting for regions, countries, sites
- exReport: exclusion and improper randomization report
- dReport: descriptive stats for baseline and longitudinal data
- eReport: event report
- survReport: time-to-event report
High-Level Functions, continued
- nriskReport: number–at–risk report (declining denominators for longitudinal data)
- (future): sequential monitoring of event incidence/stopping boundaries
- analysis variables ~ stratification vars + id(subject ID var)
PDF Model: greport Package
- R +
knitr+LaTeX+pdflatex+ Acrobat Reader - Pop-ups provided by
javascriptshow detail - Report using real RCT data
Longitudinal data, no geographical regions - Report using simulated RCT data
Multinational clinical trial: region/country/site
Problems with PDF Model
- Exquisite control of formatting; beautiful printing
- Only Adobe Acrobat Reader supports
javascriptinpdffiles, for pop-ups etc. - Acrobat Reader is poorly supported and bloated
- Minor update to Acrobat Reader on Macs disabled pop-ups
Problems with PDF Model, continued
- Extensive styling/programming in
LaTeXis hard - Copying and pasting advanced tables from
pdfintoWorddoesn’t work well - Graphics are static, without drill-down
- Code all present/absent
New HTML Model: hreport Package
- RMarkdown → html documents
- html reports allow interactive graphics
- HTML5, self-contained
javascript - Viewable in any browser
- R functions write HTML
- Regular tabular output, hyperlinks, navigation bars, etc.
- Advanced tables
htmlTablepackage andHmiscsummaryM
New HTML Model, continued
- R programming key: abstract markup, store translations in a central place
- plain text, HTML,
LaTeX - Go through the pain of figuring out markup for χ 2 7 once
- R
HmiscpackagemarkupSpecslist: large number of translations and helper functions - Special
LaTeX/HTMLtranslation tables for functions - Fine tuning: edit one file, markup used by many functions
- plain text, HTML,
Major Philosophical Difference for hreport
- Almost no tables
- Hover over a graphical element to see the relevant portion of a table
New HTML Model: Drawbacks
- HTML file can contain real data, not just relative coordinates of points
- Self-contained HTML files can be large
- No concept of pagination and other special control for pretty printing
- But: Nice format on any device (dynamic resizing)
hreport Example html Reports
- Report using real RCT data
Longitudinal data, no geographical regions - Report using simulated RCT data
Multinational clinical trial: region/country/site
For More Information
biostat.mc.vanderbilt.edu/RCTGraphicsgithub.com/harrelfe
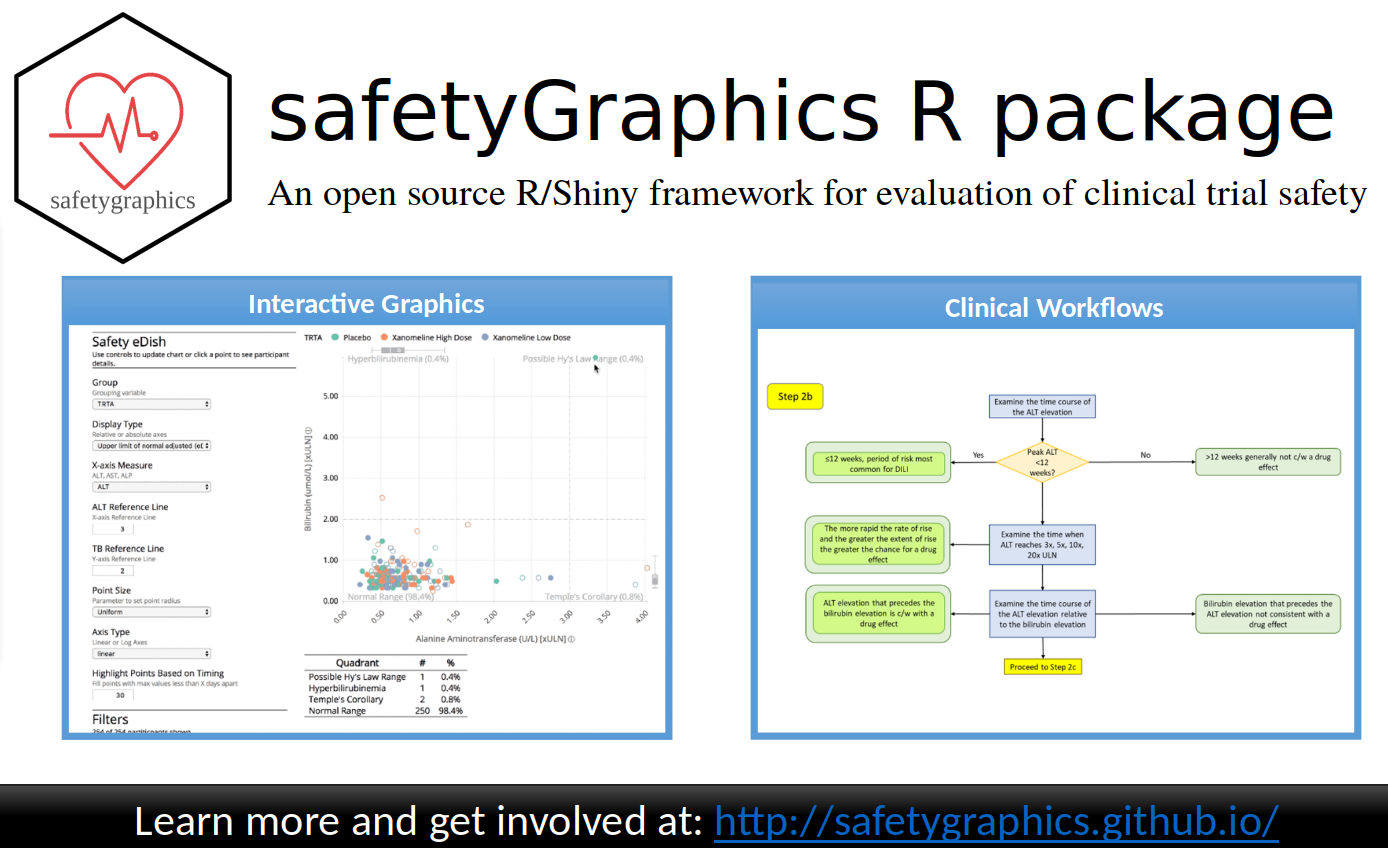
An Advertisement for A Pharmaceutical Safety Toolset
safetyGraphics
- Collaborative open source effort from
- pharmaceutical industry
- FDA
- academia
- Lead developer: Jeremy Wildfire of Rho Inc.
- Extensive clinical input
- First module: hepatotoxicity