Overview of Risk Adjustment for Provider Profiling
Frank Harrell
Professor
Department of Biostatistics
Vanderbilt University School of Medicine
2019-08-17
Basis for Provider/Hospital Profiling
- Need to have demonstrated direct link between quality of care and outcomes
- Reliable capture of the right outcomes
- Reliable capture of the right patient characteristics
- Not appropriate to adjust for post-admission complications
- Reliable capture of hospital characteristics if you want to better explain hospital differences (e.g. teaching hospitals, volume)
- Leveling the playing field through risk adjustment
- Choosing a proper statistical model
- Adjusting for all relevant risk factors
- Don’t oversimplify (example: assuming age has a linear effect)
- Quantifying evidence for hospital outcome differences
- observed/expected ratios cannot do this
- need to take all uncertainties into account
- estimate relative mortality for a hospital vs. others
- confidence intervals for ranks of hospitals
- Bayesian probability that a hospital is more than 15% worse than the others
A Note on the Medicare Star System
- Is arbitrary and has no validity
- Fundamental statistical error
- Driven by continuous metrics with arbitrary categorization
- A hospital whose underlying metric puts them at 1.99 stars before categorization is more similar to one with 2.01 stars than the hospital is to other hospitals in its own star group (e.g. a hospital with 1.0 stars)
Methods of Risk Adjustment
Indirect Adjustment
- Fit a statistical model for all hospitals combined, ignoring hospital distinctions in the model
- Use this model to predict individual patient risk for a generic hospital population
- Compute the sum of predicted generic individual risks for all our patients, and overage. This is the E.
- Take ratio of our observed number of deaths (O) to this E
- Completely ignores the fact the E is not known but is estimated
- Takes only uncertainty in O into account
- Fundamental question: How would patients at my hospital fare were they as a group be treated by a generic hospital?
- By failing to utilize individual patient data in the summarization stage, violates rules of proper conditioning
- This means we’re not comparing like with like except in some kind of average sense
- This causes Simpson’s “paradox”
- Example: van de Mheen and Shojania 2014
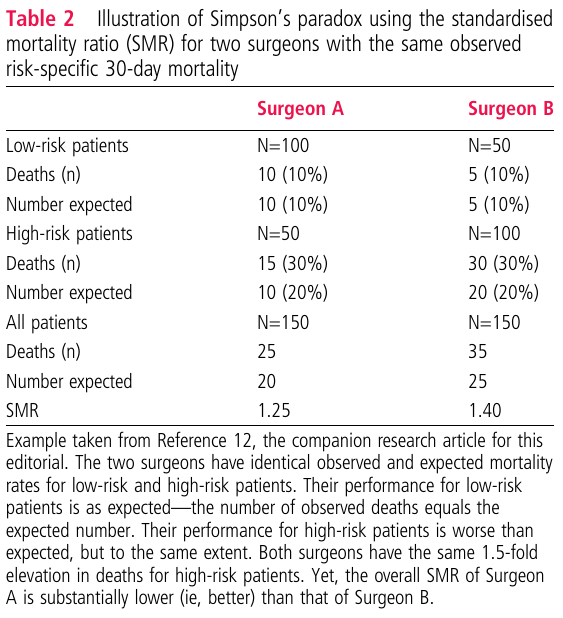
- With direct adjustment (fitting a unified logistic regression model) the two surgeons are identical
- Problem with mixing high- and low-risk patients into overall “expected” and “observed”
- O/E ratios are suitable only for single-hospital monitoring
- If allergic to developing our own model
- A local model could take into account variables not in the national models:
- distance from home to VUMC
- distance from home to various pollution sources
- distance from home to various specialty care facilities
- Could also model age correctly (usually see an acceleration of mortality after age 70)
Direct Adjustment
- Fundamental question: How would this patient fare were she to be treated at a specific hospital?
- Allows all hospitals to differ in adjusted mortality while estimating the effects of risk factors
- Incorporates uncertainties of risk factor effects while estimating hospital effects
- Hospitals are modeled using random effects
- Statistical parameters estimated in such a way that
- the model doesn’t need a “whole” parameter for each hospital
- small volume hospitals get better estimates by borrowing information from the grand mean
- hospital effects are connected to one another by assuming the variance of all the hospital effects is finite
- Risk factor effects (fixed effects) are modeled the usual way
- Random effects provide the most reliable individual hospital estimates (lowest mean squared errors)
- One hospital is not compared to the average of others, but to all the hospitals
- Efron and Morris example: random effects result in more accurate forecasting of final batting average if the average after the first 45 at bats is blended with the average of all player’s batting averages
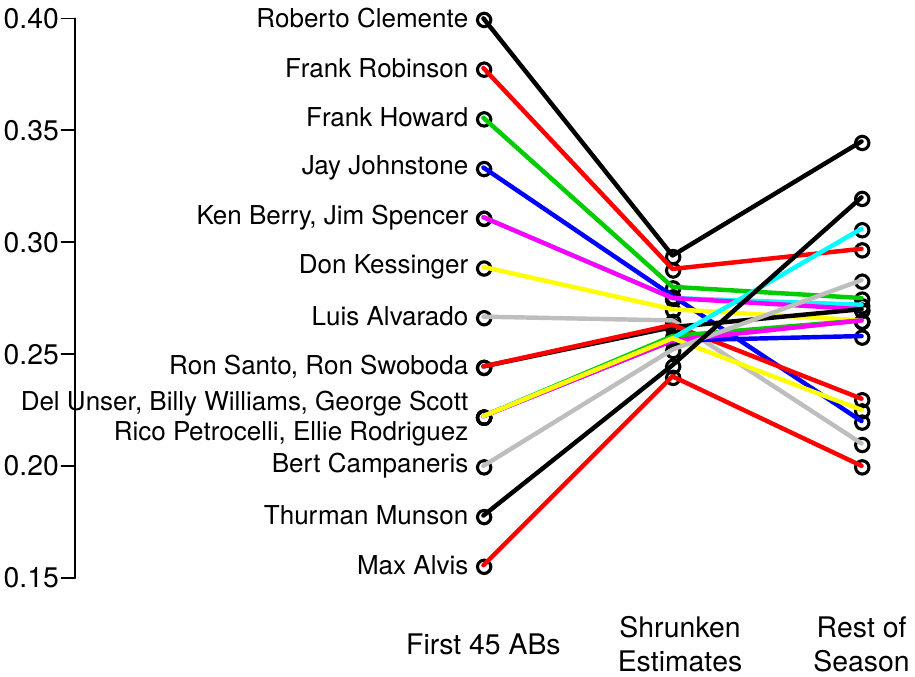
Were a batter to have only 20 ABs, his estimate would be shrunk even more to the grand mean that what is shown there
One hospital’s parameter in a logistic random effects model: the offset that hospital has from the others (log relative odds)
Can be translated with a Bayesian model to
- The probability that the hospital is more than 15% worse (on the odds ratio scale) than the median of all the hospitals
- A 0.95 credible interval (like a confidence interval) for the rank of a specific hospital
This is how we analyze neurosurgery practices in the national neurosurgery Quality Outcomes Database using full Bayesian modeling
Hospital comparisons are properly conservative in the sense of the model fully taking into account uncertainties of risk factor effects
Comparison of Direct and Indirect Adjustment
Indirect adjustment through the use of observed to expected estimates has a long history but was never a good idea. It is overconfident by not taking uncertainty of coefficient and risk estimates into account. But more serious is the failure to answer the right question, which can result in inadequate “leveling of the playing field” and unreliable outcome quality rankings of providers. For mortality reporting for hospitals, the expected number of deaths for a hospital is the sum of all the predicted mortality risks for the patients in that hospital. For example, if there were only 3 patients, one with a risk of 0.5 and the other two with a risk of 0.25, the expected number of deaths from among the three patients is 1.0. The expected risks come from pooling all data from all hospitals and fitting, for example, a binary logistic regression model. Expected risk are pooled estimates averaged over all hospitals (ironically, including the hospital being evaluated, but this matters little when the number of hospitals is very large). The use of expected number of deaths does not answer the question of what happened to the higher risk (0.5) patient vs. what happened to the lower risk (0.25) patients. It answers the question of what is the expected number of deaths were all the single hospital’s patients reassigned at random to different hospitals across the country. Most importantly, it does not answer the question that is most needed in medical decision making: what is likely to happen to the current patient were she treated at another hospital vs. would would happen to her at the hospital in question.
Contrast that with direct adjustment that includes random effects for all hospitals in a single unified model. This is a patient-specific model that allows one to predict what would happen to an individual patient were she treated at hospital y instead of hospital x. When a patient has the option of choosing a hospital, this is precisely the input needed. Observed to expected ratios average over all types of patients, resulting in estimates that may not apply to any individual patient, and through Simpson’s paradox may not even rank hospitals correctly on the average.
Observed:expected (standardized mortality ratios) may sometimes be useful for selecting optimum care for a diverse batch of patients, but not for individual patients.
Links
hbiostat.org/papers/hsor/providerProfiling/links.html