Decision curve analysis for quantifying the additional benefit of a new marker
2022
biomarker
accuracy-score
decision-making
diagnosis
medicine
This article examines the benefits of decision curve analysis for assessing model performance when adding a new marker to an existing model. Decision curve analysis provides a clinically interpretable metric based on the number of events identified and interventions avoided.
Decision curve analysis for quantifying the additional benefit of a new marker
Decision curve analysis is a method to quantify the clinical utility of a model. While discrimination, calibration and other metrics can be used to compare the performance of models, these methods do not give us information on whether the application of a model in a real-life setting would be appropriate or beneficial.
For example, take the question of whether using a model including age, sex and cholesterol is better than a model with age and sex alone at identifying patients with chest pain who have a risk of coronary artery disease (CAD) and should undergo cardiac catheterization. To utilize the new model, a blood draw must be performed to measure the patient’s cholesterol. However, if using the new model with cholesterol could help ensure that the patients with CAD are treated while allowing patients without CAD to avoid the invasive cardiac catheterization procedure, then requiring a blood draw may be reasonable. Decision curves allow us to assess the risk-benefit balance associated with adding cholesterol to the age and sex model.
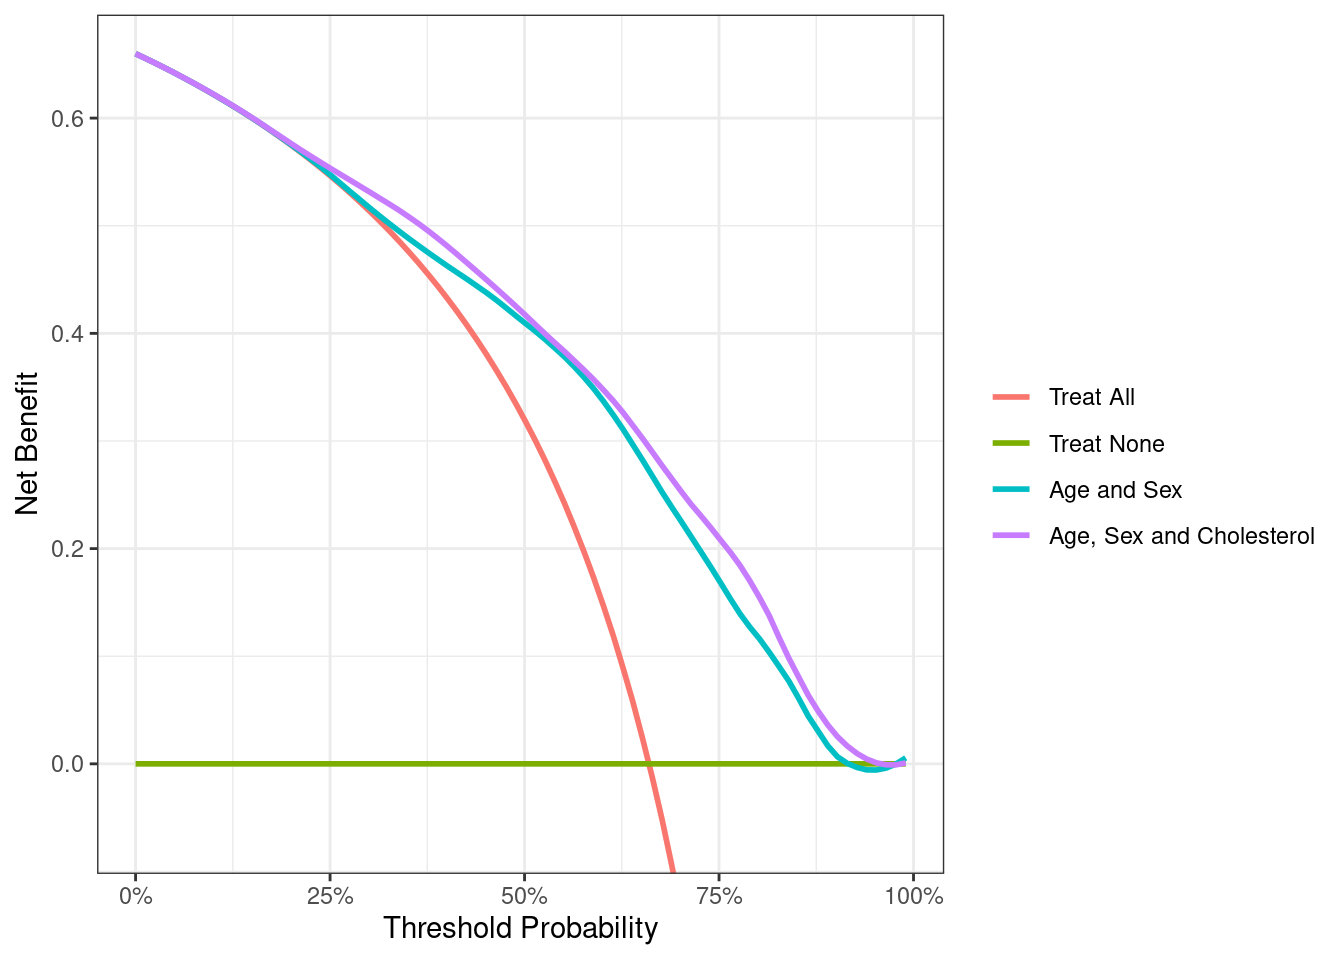
The x-axis is “threshold probability” while the y-axis is “net benefit”. The threshold probability is the risk level that would prompt an intervention. For example, a threshold probability of 10% would indicate that anyone who had a risk from the model of ≥10% would receive the intervention. Net benefit is calculated as true positives minus false positives, where the latter is given a weighting factor related to the relative benefits and harms of each. Generally in medicine, it is more beneficial to have a true positive (e.g. find a cancer) than it is harmful to have a false positive (e.g. an unnecessary biopsy). Hence false positives are often downweighted in the net benefit calculation. The weights are actually derived from the threshold probability: for more on net benefit and its calculation and interpretation, see www.decisioncurveanalysis.org.
Interpretation of the decision curve comes down to comparing the net benefit between the models and for the default strategies of intervening on all or no patients for the threshold probability of interest. Choosing the threshold probability of interest depends on the trade-off between the risk of the test and the intervention and the preferences of the doctor and patient.
For a younger, healthier patient, a doctor may be more willing to intervene and perform a cardiac catheterization at a lower risk threshold, like 15%. A 15% risk threshold implies that missing a case of CAD that requires catheterization is approximately 6 times as harmful as an unnecessary catheterization (odds ratio 85%/15% = 5.7), so we would be willing to accept the risk associated with catheterization from 6 similar patients to avoid missing a diagnosis and treatment for 1 young healthy patient.
On the other hand, an older, sicker patient may be at a higher risk and receive less benefit from cardiac catheterization and would prefer only to undergo catheterization if they are at a relatively high risk, for example, 35% or higher. Hence we should really only show the decision curve for the range of 15% to 35%.

Up to a risk threshold of about 20%, there is only a very slight difference between the age and sex model and the age, sex and cholesterol model – they both pretty much overlap with the “treat all” line. At higher threshold probabilities, there appears to be a slight benefit associated with adding cholesterol to the model, because the purple line for the cholesterol model indicates a higher net benefit than the model without.
We can also create a corresponding plot where the y-axis is “net reduction in interventions” rather than net benefit. This shows the number of patients who would avoid catheterization – holding the number of cases of CAD found constant – using the cholesterol model instead of age and sex alone.

Below is a table which shows the net benefit, difference in net benefit and net difference in interventions avoided for threshold probabilities from 5-50% (we’ve gone a bit wider than 15% to 35% for the purposes of illustration). A net difference in interventions avoided of 1 means that, if we decide on catheterization based on the model including cholesterol rather than age and sex alone, we will have to do one fewer catheterization for every 100 patients, while keeping the number of cases of CAD found constant.
| Threshold | Net Benefit (Age+Sex) | Net Benefit (Age+Sex+Cholesterol) | Difference in Net Benefit | Net Difference in Interventions Avoided per 100 patients |
|---|---|---|---|---|
| 5% | 0.6420 | 0.6420 | 0.0000 | 0.0004 |
| 10% | 0.6221 | 0.6222 | 0.0001 | 0.0013 |
| 15% | 0.6000 | 0.6006 | 0.0005 | 0.0031 |
| 20% | 0.5752 | 0.5752 | 0.0000 | 0.0000 |
| 25% | 0.5477 | 0.5545 | 0.0068 | 0.0204 |
| 30% | 0.5150 | 0.5321 | 0.0171 | 0.0399 |
| 35% | 0.4902 | 0.5085 | 0.0183 | 0.0340 |
| 40% | 0.4616 | 0.4814 | 0.0198 | 0.0297 |
| 45% | 0.4380 | 0.4512 | 0.0132 | 0.0161 |
| 50% | 0.4101 | 0.4181 | 0.0080 | 0.0080 |
What this table shows is that (with the exception of the 20% threshold, an effect we can likely attribute to statistical noise) the model including cholesterol leads to a net difference in interventions. However, at some thresholds, e.g. 10 or 15%, the effect is very small. A net difference of 0.31 means that we would have to apply the cholesterol model rather than the age and sex model to over 300 patients to avoid one catheterization procedure.
This illustrates the value of net benefit for quantifying the benefit of additional markers. Most patients have a cholesterol available, and even if someone doesn’t, it is a quick, virtually painless and inexpensive test. So yes, we would probably take 300 cholesterol measurements to avoid one cardiac catheterization. This is likely not true for a more expensive, inconvenient or invasive test. For instance, it is unlikely that we would be willing to subject over 300 patients to an MRI to prevent one undergoing a cardiac catheterization.
Compare this to other metrics for quantifying the added value of a predictor in a model, such as assessing variation or R2. What value of the ratio of variances of the predicted values would indicate that we should use cholesterol or MRI? What increment in AUC would be worthwhile?
Decision curve analysis provides a clinically interpretable metric because it is given in clinical terms: cases of CAD found or cardiac catheterizations avoided.