RCT Outcome Overview
- Function & symptoms important to the patient must be included
- Results of analyzing an outcome that is masked by another are impossible to interpret
- Example: functional status in survivors
- Serious clinical events should be part of any outcome
- Fundamental outcome unit: current state
RCT Outcome Overview, continued
- On a given day, how bad is the worst thing that happened to the patient?
- Fundamental analytical tool: longitudinal state transition models
- Y = ordinal scale for a time period, including clinical event overrides
Analytical Options
WIN and DOOR
- WIN ratio/odds and DOOR (desirability of outcome rankings) are longitudinal extensions of the Wilcoxon two-sample test
- Gain power by breaking ties in time-to-event outcomes
- Provide only within-study estimand; no clinical-scale readouts
- Pr(randomly chosen pt on B has better outcome than pt on A)
- How much better?
- What is the outcome of pts on Tx B?
WIN and DOOR, continued
- The relative ordering estimand is influenced by narrowness of study inclusion criteria
- Similar to reporting
- Very difficult to deal with missing component data + covariate adj.
- Results depend on the distribution of censoring times
- Assumes Tx affects all outcome categories equally
Ordinal Longitudinal Models (OLM)
- Extension of Wilcoxon test and Cox model to allow covariate adjustment + repeated measures
- Most flexible form uses a Markov process for an ordinal state transition model
- Demonstrated to handle within-pt serial correlation almost perfectly in multiple RCTs
- Better modeling of intra-pt correlation
- Elegantly handles missing components + absorbing states precluding pt scale assessment
- Death and need for rescue therapy accounted for
OLM, continued
- Underlying statistical parameter is a transition odds ratio for Tx
- Huge variety of clinical readouts
- Pr(transitioning to state
- Pr(being at severity y or worse as a function of time, Tx)
- Mean time in any set of states
- Treatment difference in expected time in specified states (like
- Pr(transitioning to state
- Generalizes Wilcoxon test, Cox model, recurrent event analysis, and longitudinal analysis
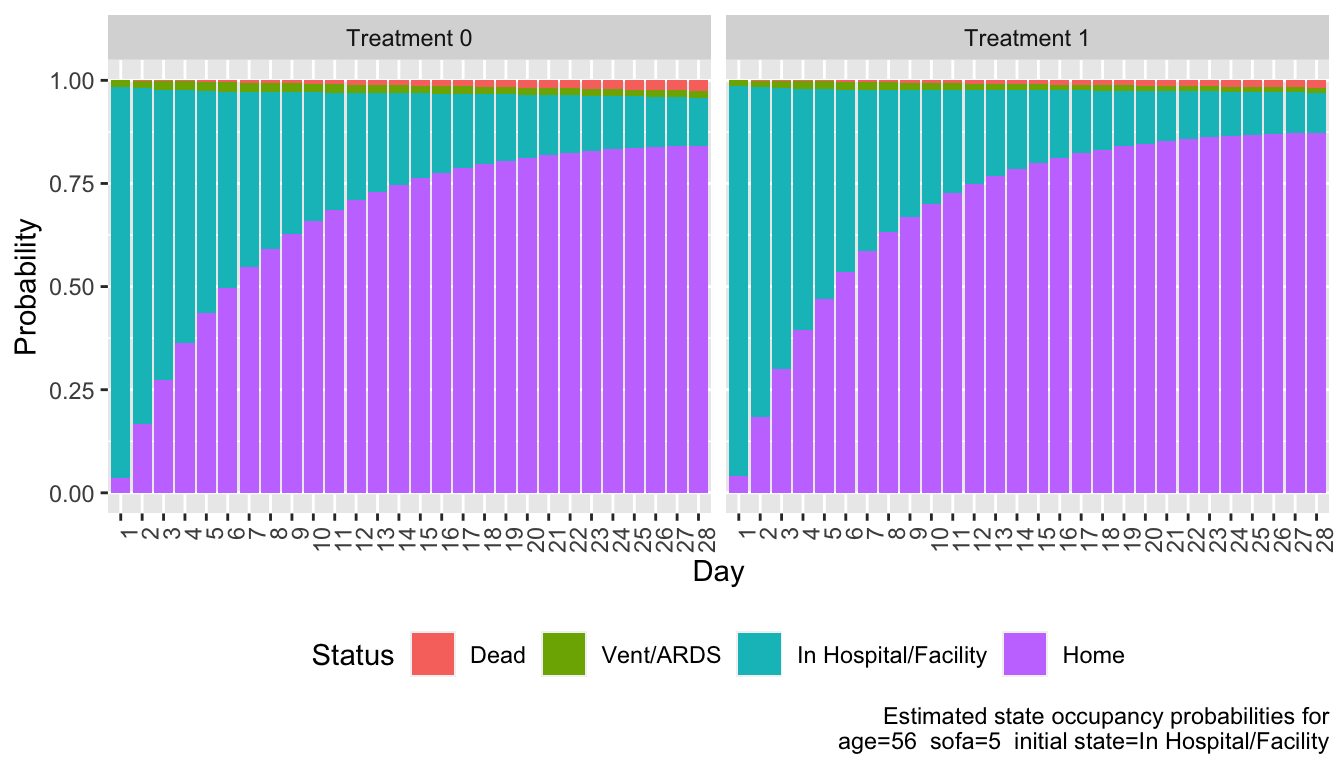
Popular OLM Readout

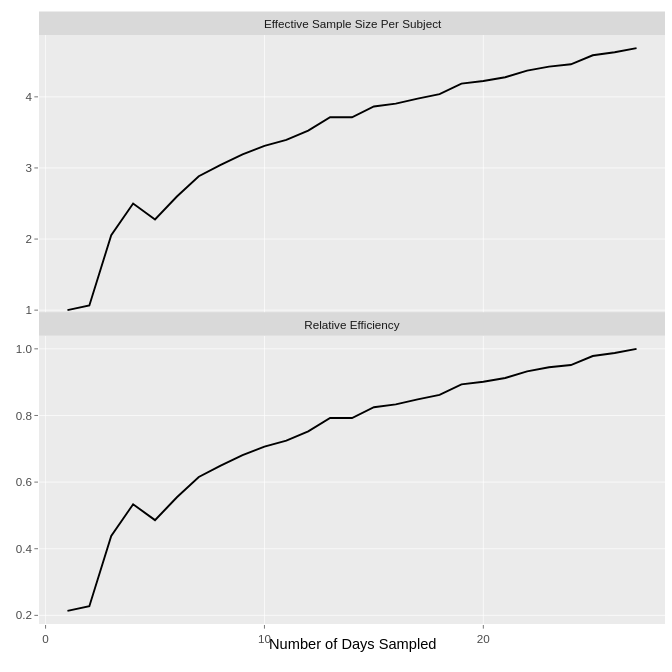
Efficiency Gain:

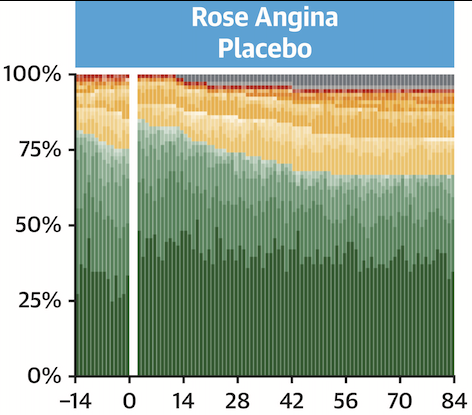
Another OLM Example: ORBITA-2
FA Simader et al (2024): Symptoms as a predictor of the placebo-controlled efficacy of PCI in stable coronary artery disease. JACC 84: 13-24.
- Daily angina frequencies
- Y = ordinal scale
- Angina frequencies magnified by # units of anti-anginal meds required to control angina
- Clinical event overrides at top of scale
- Graphic design by Matthew Shun-Shin, Imperial College London


OLM, continued
- OLM works for Tx that improves pt condition as well as for Tx for slowing progression
- Detailed case study with complete R code at hbiostat.org/rmsc/markov
- FDA CDER OB project underway to reanalyze an ALS trial using OLM

First-Order Discrete Time Markov Proportional Odds Model
- Current state depends only on covariates, previous state
- Let measurement times be
- Transparent, verifiable assumptions
Markov OLM, continued
- Simple sums of multiplied transition probabilities to uncondition on previous states
- SOPs are ITT quantities with standard causal interpretation
- Example: death is the only outcome
- Transition odds ratio
- SOP = cumulative incidence of mortality
SOPs, continued
- General example: SOP at 6 months
- Probability that functional ability is worse than
- Prob. that function is better than
- Probability that functional ability is worse than
- Sum of SOPs over regularly-spaced times is mean time in state
- Mean # days alive and well
- Gain (difference) in mean # days alive and well due to treatment
- Mean time in state is simple even with time
Unified Approach
- Standard longitudinal continuous
- Longitudinal continuous or ordinal
- Easily handles multiple absorbing states
- Serial correlation: condition on previous outcome
- Random intercepts (compound symmetry correlation): condition on average of all previous outcomes
Examples of Longitudinal Ordinal Outcomes
- 0=alive 1=dead
- censored at 3w: 000
- death at 2w: 01
- 0=at home 1=hospitalized 2=MI 3=dead
- hospitalized at 3w, rehosp at 7w, MI at 8w & stays in hosp, f/u ends at 10w: 0010001211
Examples, continued
- 0-6 QOL excellent--poor, 7=MI 8=stroke 9=dead
- QOL varies, not assessed in 3w but pt event free, stroke at 8w, death 9w: 12[0-6]334589
- MI status unknown at 7w: 12[0-6]334[5,7]89
- Can make first 200 levels be a continuous response variable and the remaining values represent clinical event overrides
Extension of OLM: Partial Proportional Odds Markov Model
- Allows effect of Tx to vary over outcome categories
- Example: Tx may affect mortality differently than how it affects function/Sx
- Bayesian prior can specify limits on the amount of borrowing of Tx effects across outcomes
- Example Bayesian posterior prob.: probability that Tx affects death by
- See fharrell.com/post/yborrow
Composite Outcome Scales
- Choice of scales is very important
- Gold standard is pt utility for current status
- OLM approximates the gold standard
- Several ways to combine multiple scales
Analyzing Multiple Scales That Can't Be Combined Into an Ordinal Scale
- Multiple functional / symptom / QOL scales at a given time
- Not recommended: combining separate
- Time-trade-off to arrive at overall utility, but difficult
- Ordinal regression to relate all scales to an ultimate outcome or pt global scale
- Projects all scales into a single global scale for OLM
How to Analyze Multiple Scales, continued
- Take one outcome scale as an anchor, calibrate all scales to it
- Compute optimum weighted average of scales
- Treat as ordinal
- Add clinical event overrides
- Put all scales on the same Likert scale
- Ask pt which scale is most important to them
- Use that scale for that patient, as ordinal
A Completely Different Approach (Bayesian)
- Bayesian multivariate model using all scales
- Copula or correlated random effects to model scale dependencies
- For
- Probability treatment has any effect on some of the outcomes and a major effect on one particular outcome
More Information
- Composite outcomes: fharrell.com/talk/cos (also includes the "time savings" approach)
- Composite outcome details: hbiostat.org/doc/comp
- General principles for constructing clinical endpoints: hbiostat.org/endpoint
- OLM: hbiostat.org/proj/covid19
- Ordinal regression: hbiostat.org/ordinal