Challenges of High-Dimensional Data Analysis
NoteAbstract
This talk will discuss challenges and hazards in learning from data, especially when analyzing a large number of patient features. Some of the points that will be emphasized are sample size requirements for stable and reliable results, hopelessness of feature selection, importance of computing uncertainties about feature importance, the importance of attempting only to answer questions for which the sample size is adequate, and how the latter relates to unsupervised learning (data reduction).
To Be Able to Do Feature Selection You Must Be Able to Estimate Feature Importance
- Sample size required to well estimate a single correlation coefficient is \(n=400\)
- Don’t believe feature importance when unaccompanied by uncertainty intervals
- Don’t believe feature importance when accompanied by uncertainty intervals
- Because most uncertainty intervals are too wide to learn from
- This just reflects the difficulty of the task, especially if features are correlated
- Related to ridge regression outperforming lasso
- Low-dimensional relative explained variation example
- Low-dimensional importance ranks example
- High-dimensional importance ranks example
Side Notes
- Even if feature importance were estimable, estimating it doesn’t make ML interpretable
- False discovery rates pretend that false negative rates don’t exist
- Using SMOTE requires a very deep misunderstanding of statistics
Don’t Trust Any Method That
- Doesn’t have a sample size formula or simulation
- Doesn’t produce an unbiasedly-estimated calibration curve that is close to the line of identify
If \(n\) Is Too Small For …
- \(p = 1\) it is too small for \(p > 1\) (\(p\) = number of candidate features)
- handling \(p\) features without penalization it is usually too small for determining a good penalty factor (shrinkage; regularization)
- estimating predictive performance it is too small for developing a prediction model or forced-choice classifier
Required Sample Size as a Function of \(p\)
- Binary \(Y\), binary candidate features
- Association between \(X\) and \(Y\) quantified by odds ratio (OR)
- When \(n < \frac{p}{2}\) there is almost no relationship between true and estimated ORs
- See this
What To Do If \(n\) is Too Low for \(p\)
- If \(n > 15p\) (very roughly) the usual analyses are likely to be reliable
- If \(n < p\) things are pretty hopeless unless you’re in a high signal:noise ratio setting such as visual pattern recognition
- Recourse: compute effective sample size then estimate the complexity of the question that this sample size will allow you to ask
- Ask a simpler question than your original one
- agregate data to a coarser level
- analyze activation in 12 brain regions instead of 10,000 voxels in fMRI
- impose genetic pathways or project high-dimensional genetic variants onto lower-dimensional gene expressions or use methods with a small number of hyperparameters
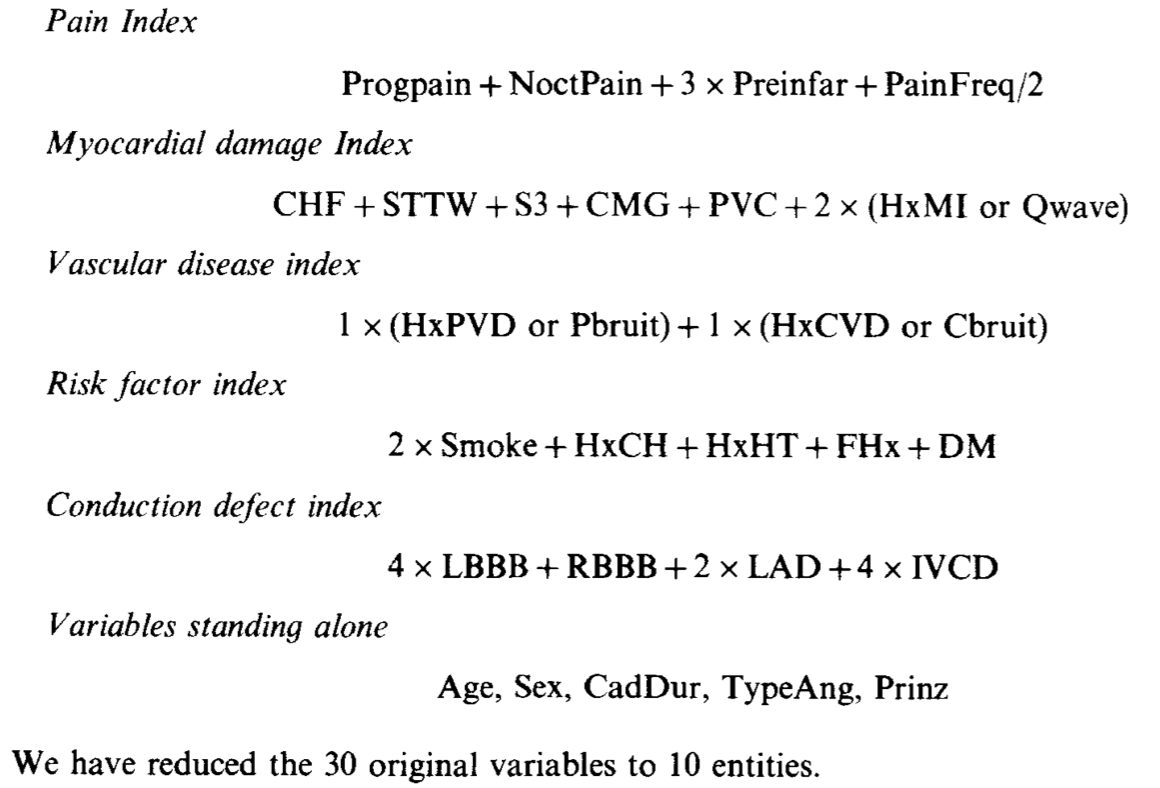
- use data reduction (unsupervised learning) to find themes in the predictors to then use against outcomes
- principal components analysis (PCA)
- variable clustering followed by PCA - see this and this
- sparse PCA
- machine learning autoencoders
- agregate data to a coarser level
- Screen candidate features
- remove genetic variances with low minor allele frequencies
- keep only genes having bimodal expression distributions (because they are thought to represent a mixture of good and bad ultimate outcomes; idea of Baggerly & Coombs)
- redundancy analysis
- Bayesian recourses
- carefully specify a prior distribution such as the horseshoe prior that models the family of effects of all candidate features
- put a prior on the overall \(R^2\) and let that filter down to put priors on all the features’ parameters
- Avoid machine learning
- machine learning other than autoencoders will not help
- reason: ML requires much higher sample sizes than statistical models
- ML does not capitalize on additivity assumptions
- allows for all possible interactions
- interaction effects are very hard to estimate
Feature Selection
- Has a very low chance of finding most of the truly important features
- Has a very low chance of not finding irrelevant features
- lasso example (link at bottom of page)
- \(n = p = 500\), binary \(X\)’s and \(Y\)
- Sample \(\beta\)’s from a Laplace distribution (optimal for lasso)
- 2000 simulations
- For each true \(\beta\) compute fraction of 2000 for which that feature was selected

It Gets Worse
- Results shown here apply to unbiased data with
- No missings
- No measurement error
- Strong study design including randomization of sample processing order
- Need to strongly adjust for readily available data
- E.g. flexible nonlinear adjustment for risk factors, extent of disease, age, symptoms, clinical chemistry, hematology variables when examinining predictive information of imaging or molecular data
- Need to quit making linearity assumptions as lasso does
Accuracy Measures
- Don’t use measures such as sensitivity, specificity, and ROC curves that are designed for retrospective case-control studies
- Don’t use measures such as precision, recall, and ROC curves that invite the use of arbitrary cutoffs on markers or predicted risks
What I’d Like to See Reported
- “We analyzed a 100,000 patient sample from the EHR. The effective sample size is estimated to be 23,000 accounting for missing values and measurement errors.”
- Figure with uncertainty intervals for feature importance
- “To select important genetic variants from the 500,000 candidates our criterion was a Bayesian posterior probability of OR outside \([0.9, \frac{1}{0.9}]\) exceeding 0.9, and to conclude a feature is unimportant the probability must be < 0.1. Unfortunately 470,000 variants had a probability in (0.1, 0.9) so we concluded that the data lacked information needed to select variants.”
- Avoidance of binary decisions, e.g. feature selection
- No use of false discovery probabilities unaccompanied by false negative probabilities
- “Feature selection found 50 important proteins. We fitted a non-parsimonious penalized model on all the 2000 non-selected proteins and obtained higher \(R^2\) with the ‘losers’. So we decided to abandon the 50-protein parsimonious result.”
- 100 repeats of 10-fold CV or several hundred bootstrap resamples to estimate overfitting-corrected
- smooth nonparametric calibration curve
- predictive performance measures (\(R^2\), Brier score, etc.)
- confidence intervals for both
- No use of temporal or geographic validation
- More modeling driven by medical/biological knowledge
- Recognition that
- more complex questions need larger sample sizes and less biased data
- unstructured analysis of \(p > \frac{n}{2}\) features is nearly futile
- unstructured analysis of \(p > \frac{n}{15} \rightarrow\) overstated effects
Resources
- Challenges of High Dimensional Data Analysis
- Regression Modeling Strategies
- Variable Selection section of RMS (includes links to other resources)
- Projection Predictive Variable Selection by Aki Vehtari
- Explainable AI in Healthcare: to Explain, to Predict, or to Describe?
- Statistical Thinking Blog Articles
- How To Do Bad Biomarker Research
- Classification is a Bad Idea
- Statistically Efficient Ways to Quantify Added Predictive Value of New Measurements
- Damage Caused by Classification Accuracy and Other Discontinuous Improper Accuracy Scoring Rules
- Clinicians’ Misunderstanding of Probabilities Makes Them Like Backwards Probabilities Such As Sensitivity, Specificity, and Type I Error
- In Machine Learning Predictions for Health Care the Confusion Matrix is a Matrix of Confusion
- Simple Bootstrap and Simulation Approaches to Quantifying Reliability of High-Dimensional Feature Selection
- How Can Machine Learning be Reliable When the Sample is Adequate for Only One Feature?
- Controversies in Predictive Modeling, Machine Learning, and Validation
- Is Medicine Mesmerized by Machine Learning?