Code
require(rms)
S <- Surv(c(1, 3, 3, 6, 8, 9, 10), c(1,1,1,0,0,1,0))
fe <- psm(S ~ 1, dist='exponential')
f2 <- psm(S ~ 1, dist='weibull')Why use a parametric model?
Note: Fitting more than two smooth survival curves and choosing the one that best reproduces the KM estimator will result in a true precision no better than KM due to model uncertainty.
\[ \log L = \sum_{i:Y_{i} {\rm\ uncensored}}^{n} \log \lambda - \sum_{i=1}^{n} \lambda Y_{i} \]
\[\begin{array}{ccc} \hat{\lambda} &=& n_{u}/w \\ {\rm var}(\hat{\lambda}) &=& n_{u}/w^{2} \\ {\rm var}(\log \hat{\lambda}) &=& 1/n_{u} \\ \hat{\mu} &=& w/n_{u} \\ \hat{S}(t) &=& \exp(-\hat{\lambda}t) \end{array}\]Consider these failure time data:
\[\begin{array}{c} 1 \ \ 3\ \ 3\ \ 6^{+}\ \ 8^{+}\ \ 9\ \ 10^{+} . \nonumber \end{array}\]\[ \log[-\log S(t)] = \log \Lambda(t) = \log \alpha +\gamma (\log t) \]
\[ \lambda(t|X) = \lambda(t) \exp(X\beta) \]
\[\begin{array}{ccc} \Lambda(t|X) &=& \Lambda(t) \exp(X\beta) \nonumber \\ S(t|X) &=& \exp[-\Lambda(t)\exp(X\beta)] = \exp[-\Lambda(t)]^{\exp(X\beta)} \end{array}\]\[ S(t|X) = S(t)^{\exp(X\beta)} , \]
Assumptions:
Here \(\exp(\beta_{1})\) is the \(X_{1}=1:X_{1}=0\) hazard ratio.
\[ \lambda(t|X_{1}) = \lambda(t)\exp(\beta_{1}X) \]
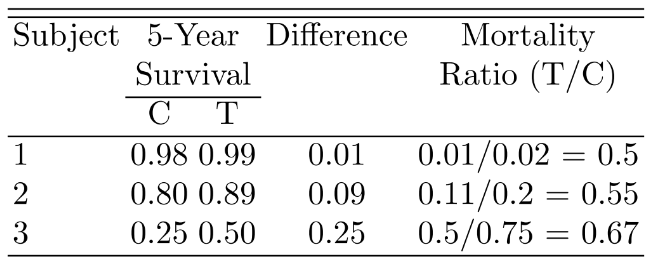
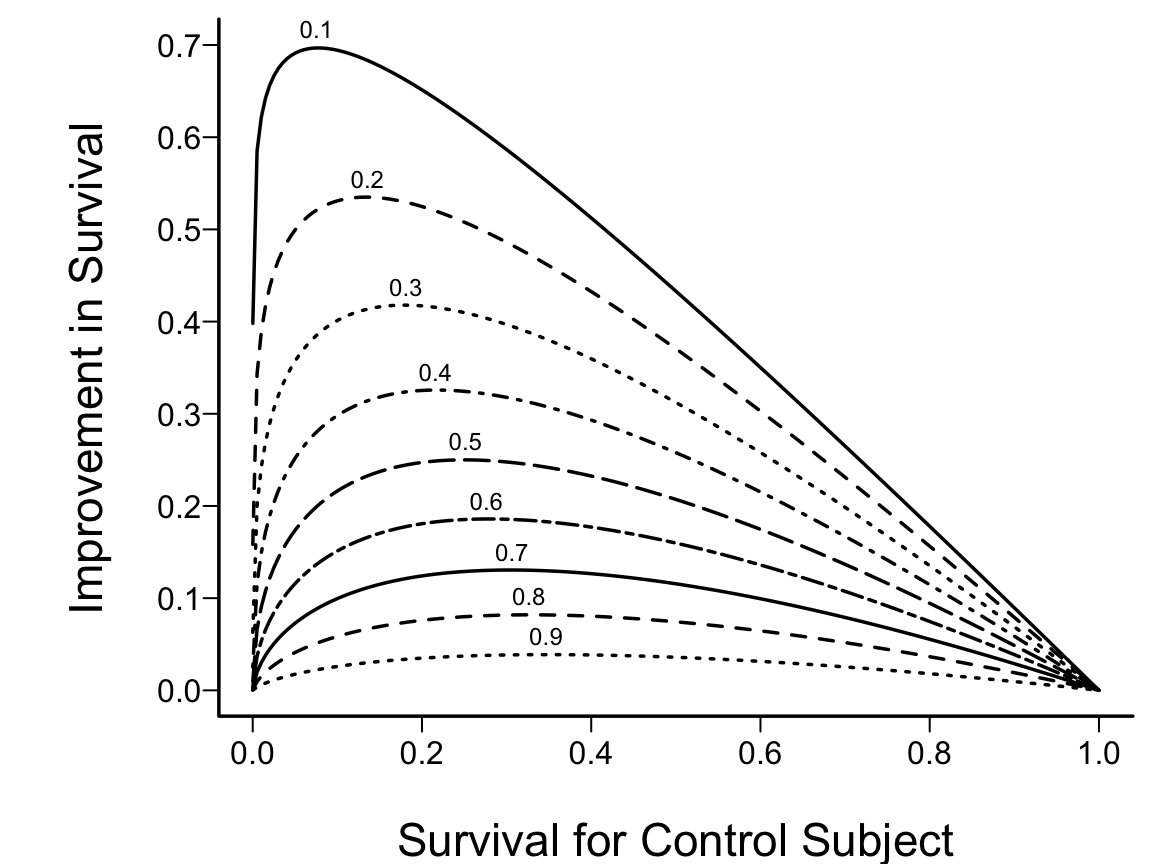
\(S_{T}=S_{C}^{0.5}\)
spar(bty='l')
plot(0, 0, type="n", xlab="Survival for Control Subject",
     ylab="Improvement in Survival",
     xlim=c(0,1), ylim=c(0,.7))
i <- 0
hr <- seq(.1, .9, by=.1)
for(h in hr) {
  i <- i + 1
  p <- seq(.0001, .9999, length=200)
  p2 <- p^h
  d <- p2 - p
  lines(p, d, lty=i)
  maxd <- max(d)
  smax <- p[d==maxd]
  text(smax,maxd+.02, format(h), cex=.6)
}
\[ T_{0.5}|X=\{\log 2 / [\alpha \exp(X\beta)]\}^{1/\gamma} . \]
For numerical reasons, re-write:
\[\begin{array}{ccc} S(t|X) &=& \exp(-\Lambda(t|X)) , {\rm\ \ \ where} \nonumber \\ \Lambda(t|X) &=& \exp(\gamma \log t + X\beta) \end{array} \tag{18.1}\]
See also spline hazard models Kooperberg et al. (1995) and the generalized gamma distribution (Cox et al., 2007).
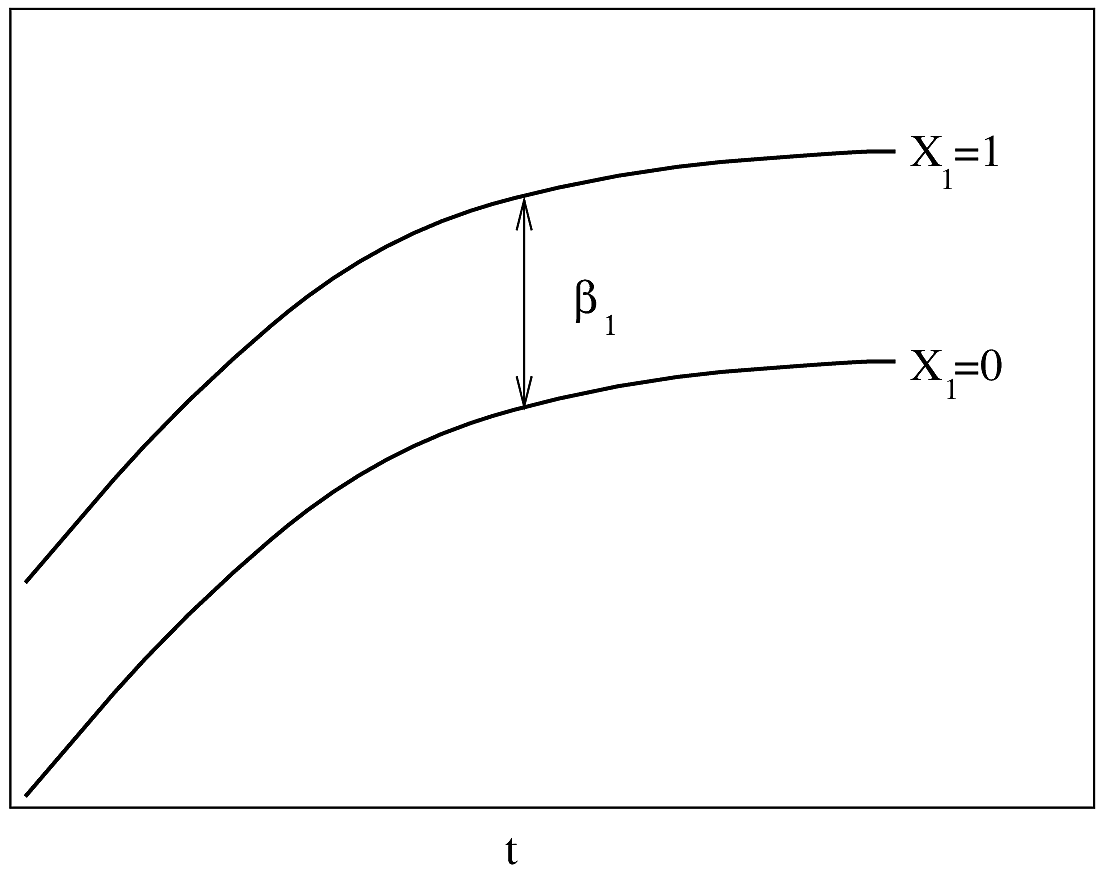
If \(\lambda(t)\) is Weibull, the two curves will be linear if \(\log t\) is plotted instead of \(t\) on the \(x\)-axis.
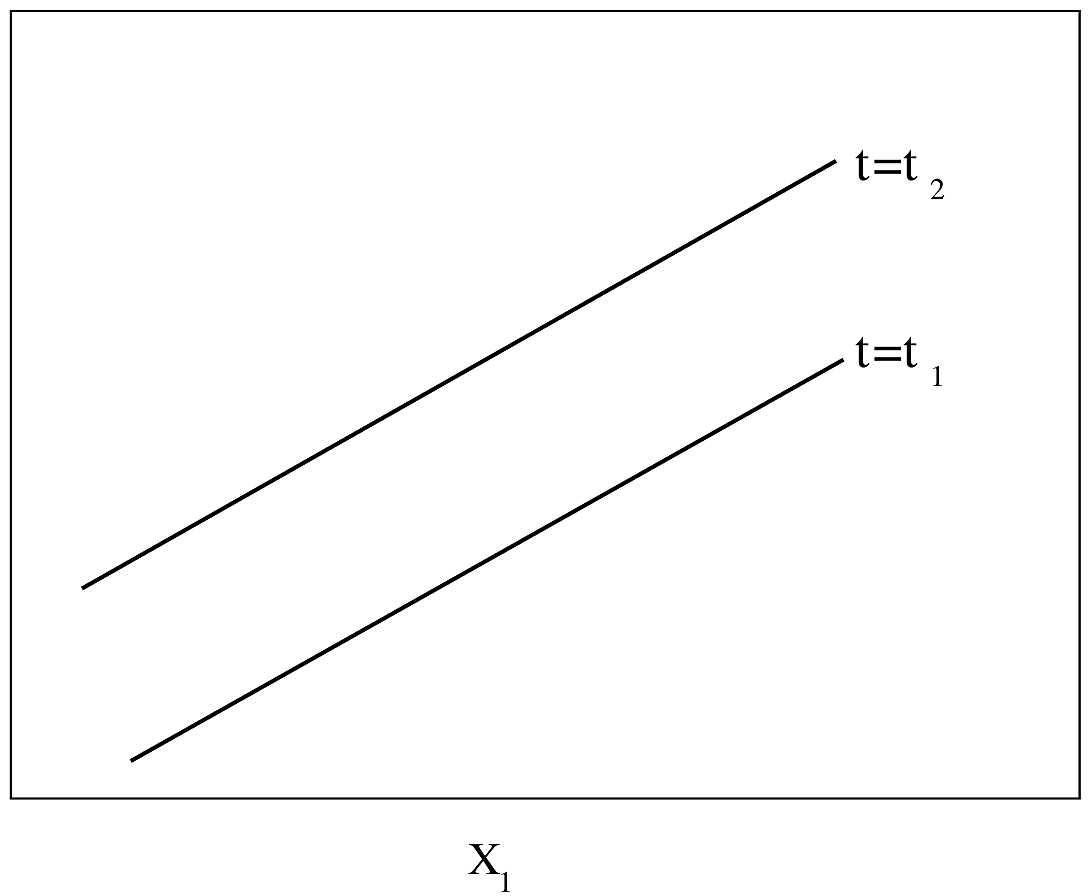
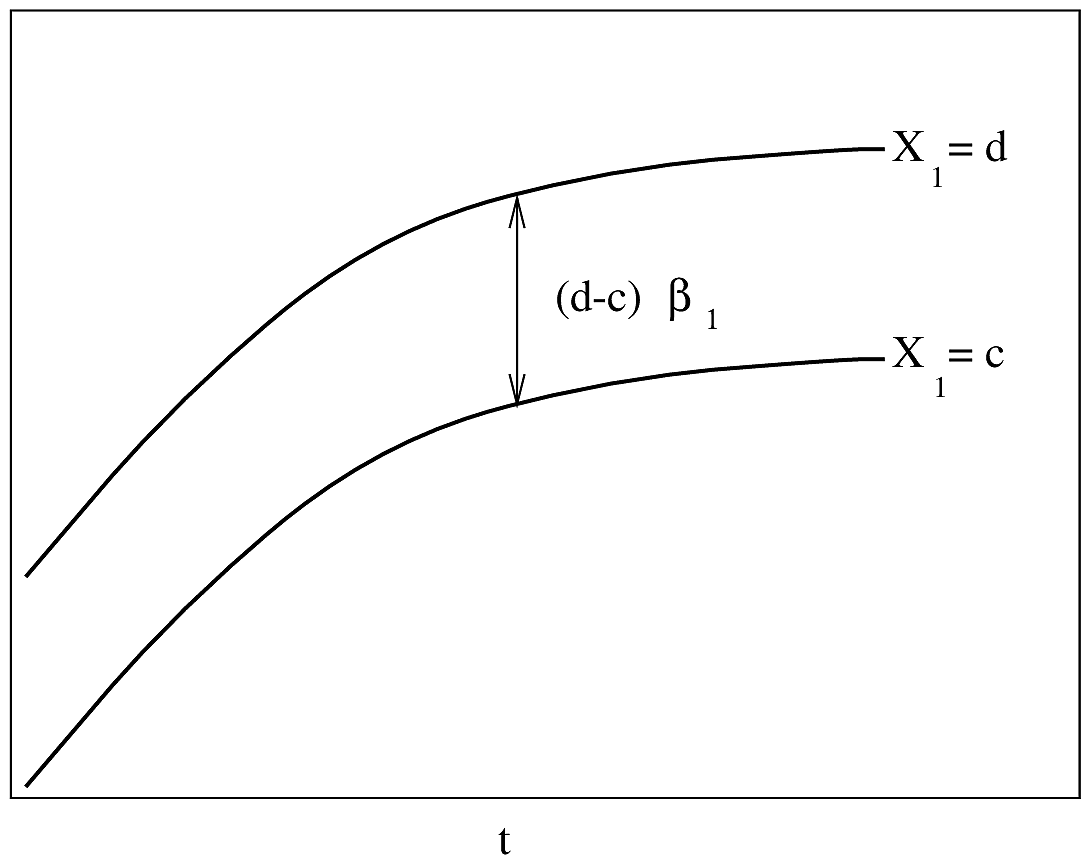
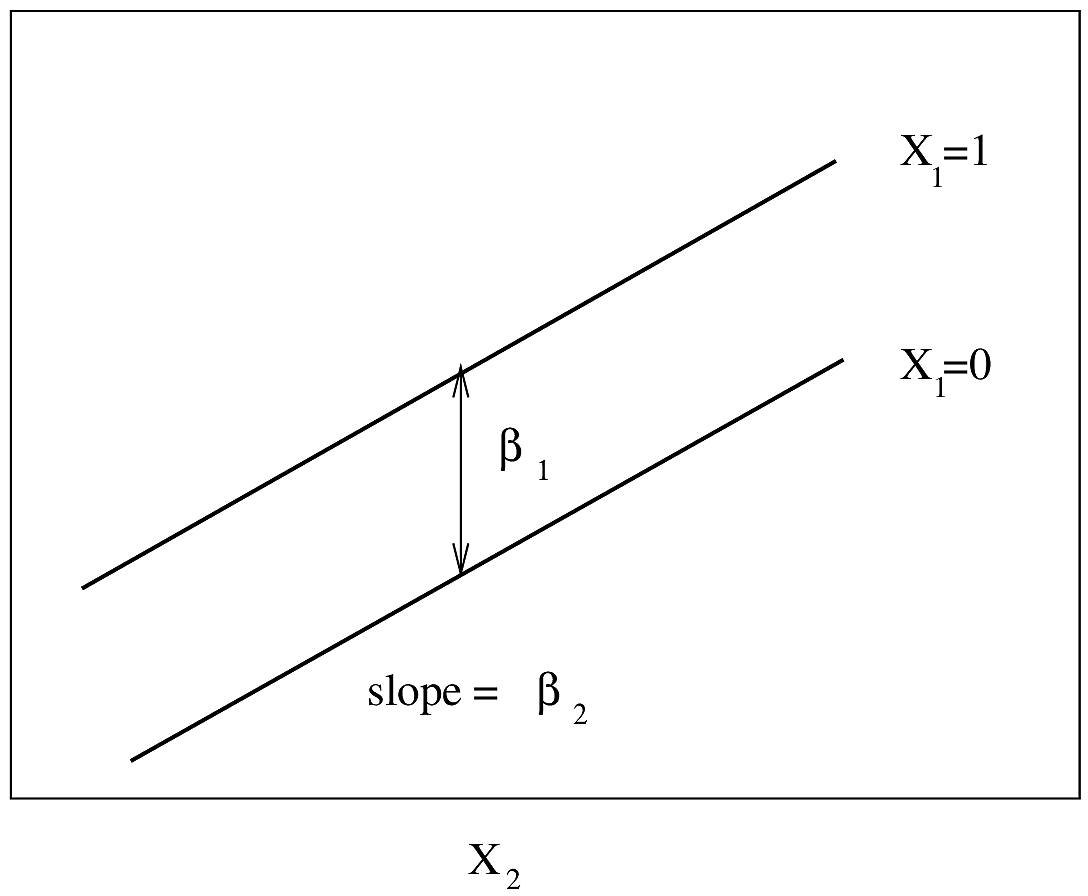
\[S(t|X) = \psi(\frac{\log(t)-X\beta}{\sigma}) \tag{18.2}\]
\[\begin{array}{ccc} \frac{\log(T)-X\beta}{\sigma} &\sim& \psi \\ \log(T) = X\beta + \sigma\epsilon \\ \epsilon \sim \psi \end{array}\]\[ \psi^{-1}(S(t|X)) = \frac{\log(t)-X\beta}{\sigma} \tag{18.3}\]
Letting \(\epsilon \sim \psi\)
\[ \log(T) = X\beta + \sigma\epsilon \]
Check that residuals \(\log(T)-X\hat{\beta} \sim \psi\) (within scale factor). The assumptions of the AFT model are thus
1-unit change in \(X_{j} = \beta_{j}\) change in \(\log T\), or increase \(T\) by factor of \(\exp(\beta_{j})\).
Median survival time:
\[ T_{0.5}|X = \exp(X\beta + \sigma \psi^{-1}(0.5)) \]
\[ S(t|X) = 1 - \Phi(\frac{\log(t)-X\beta}{\sigma}), \]
\[ S(t|X) = [1 + \exp(\frac{\log(t) - X\beta}{\sigma})]^{-1}. \]
Works better if \(\sigma\) parameterized as \(\exp(\delta)\).
\[\begin{array}{ccc} \hat{S}(t|X) &=& \psi(\frac{\log(t)-X\hat{\beta}}{\hat{\sigma}}) \nonumber \\ \hat{T}_{0.5}|X &=& \exp[X\hat{\beta} + \hat{\sigma} \psi^{-1}(0.5)]. \end{array}\]Normal and logistic: \(\hat{T}_{0.5}|X = \exp(X\hat{\beta})\)
\[ \psi(\frac{\log(t)-X\hat{\beta}}{\hat{\sigma}}\pm z_{1-\alpha/2}\times s) \]
For an AFT model, standardized residuals are simply
\[ r = (\log(T)-X\hat{\beta})/\sigma \tag{18.4}\]
When \(T\) is right-censored, \(r\) is right-censored.
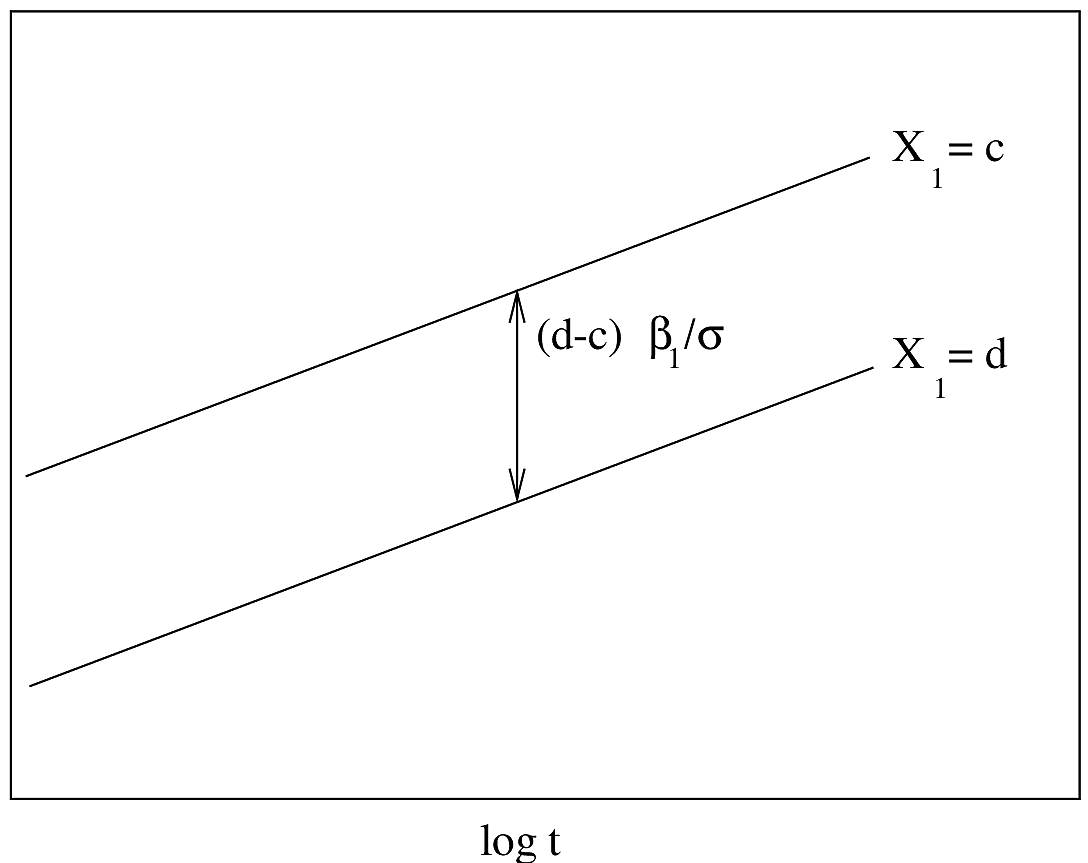
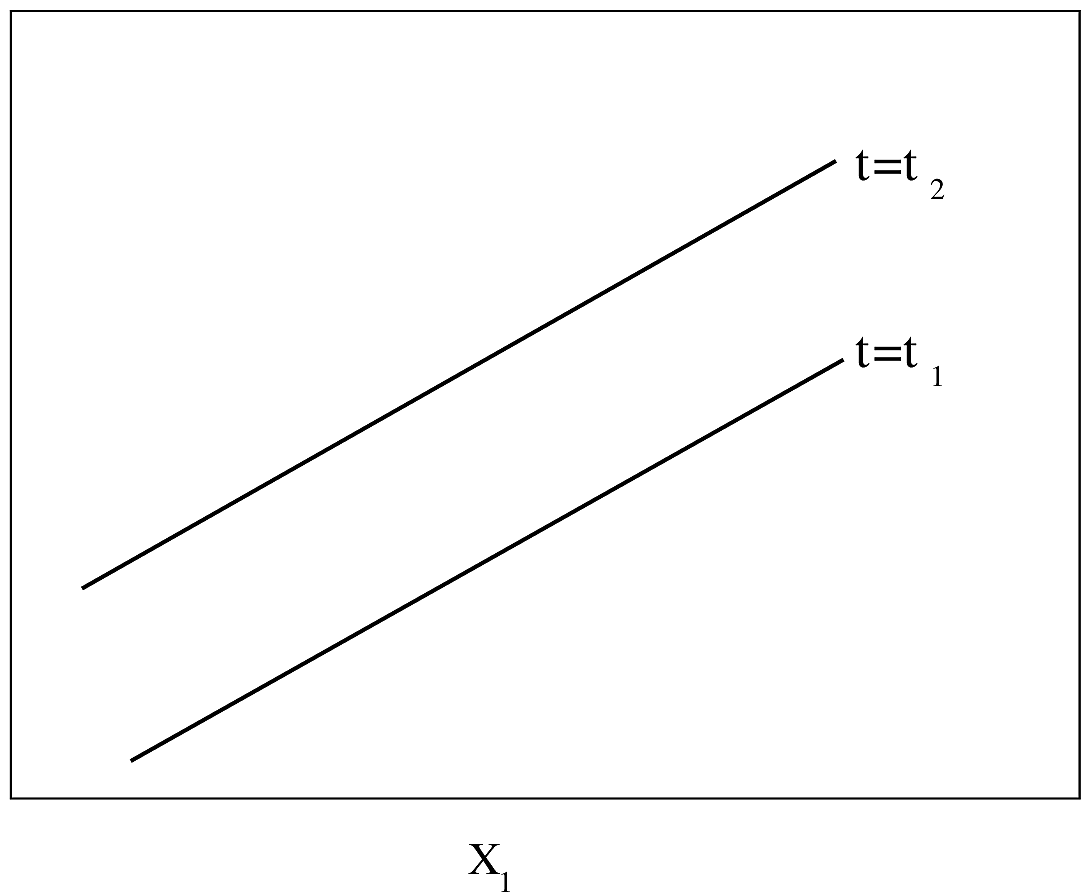
| Group 1 | 143 | 164 | 188 | 188 | 190 | 192 | 206 | 209 | 213 | 216 |
| 220 | 227 | 230 | 234 | 246 | 265 | 304 | 216\(^{+}\) | 244\(^{+}\) | ||
| Group 2 | 142 | 156 | 163 | 198 | 205 | 232 | 232 | 233 | 233 | 233 |
| 233 | 239 | 240 | 261 | 280 | 280 | 296 | 296 | 323 | 204\(^{+}\) | |
| 344\(^{+}\) |
spar(mfrow=c(2,2), top=1, bot=2, mgp=c(2.75, .365, 0))
getHdata(kprats)
kprats$group <- factor(kprats$group, 0:1, c('Group 1', 'Group 2'))
dd <- datadist(kprats); options(datadist="dd")
S <- with(kprats, Surv(t, death))
f <- npsurv(S ~ group, type="fleming", data=kprats)
survplot(f, n.risk=TRUE, conf='none',
         label.curves=list(keys='lines'), levels.only=TRUE)
title(sub="Nonparametric estimates", adj=0, cex=.7)
# Check fits of Weibull, log-logistic, log-normal
ggplot(f, trans='loglog', logt=TRUE, conf='none') +
  labs(title='Weibull (extreme value)')
ggplot(f, trans='logit',  logt=TRUE, conf='none') +
  labs(title='Log-logistic')
ggplot(f, trans='probit', logt=TRUE, conf='none') +
  labs(title='Log-normal')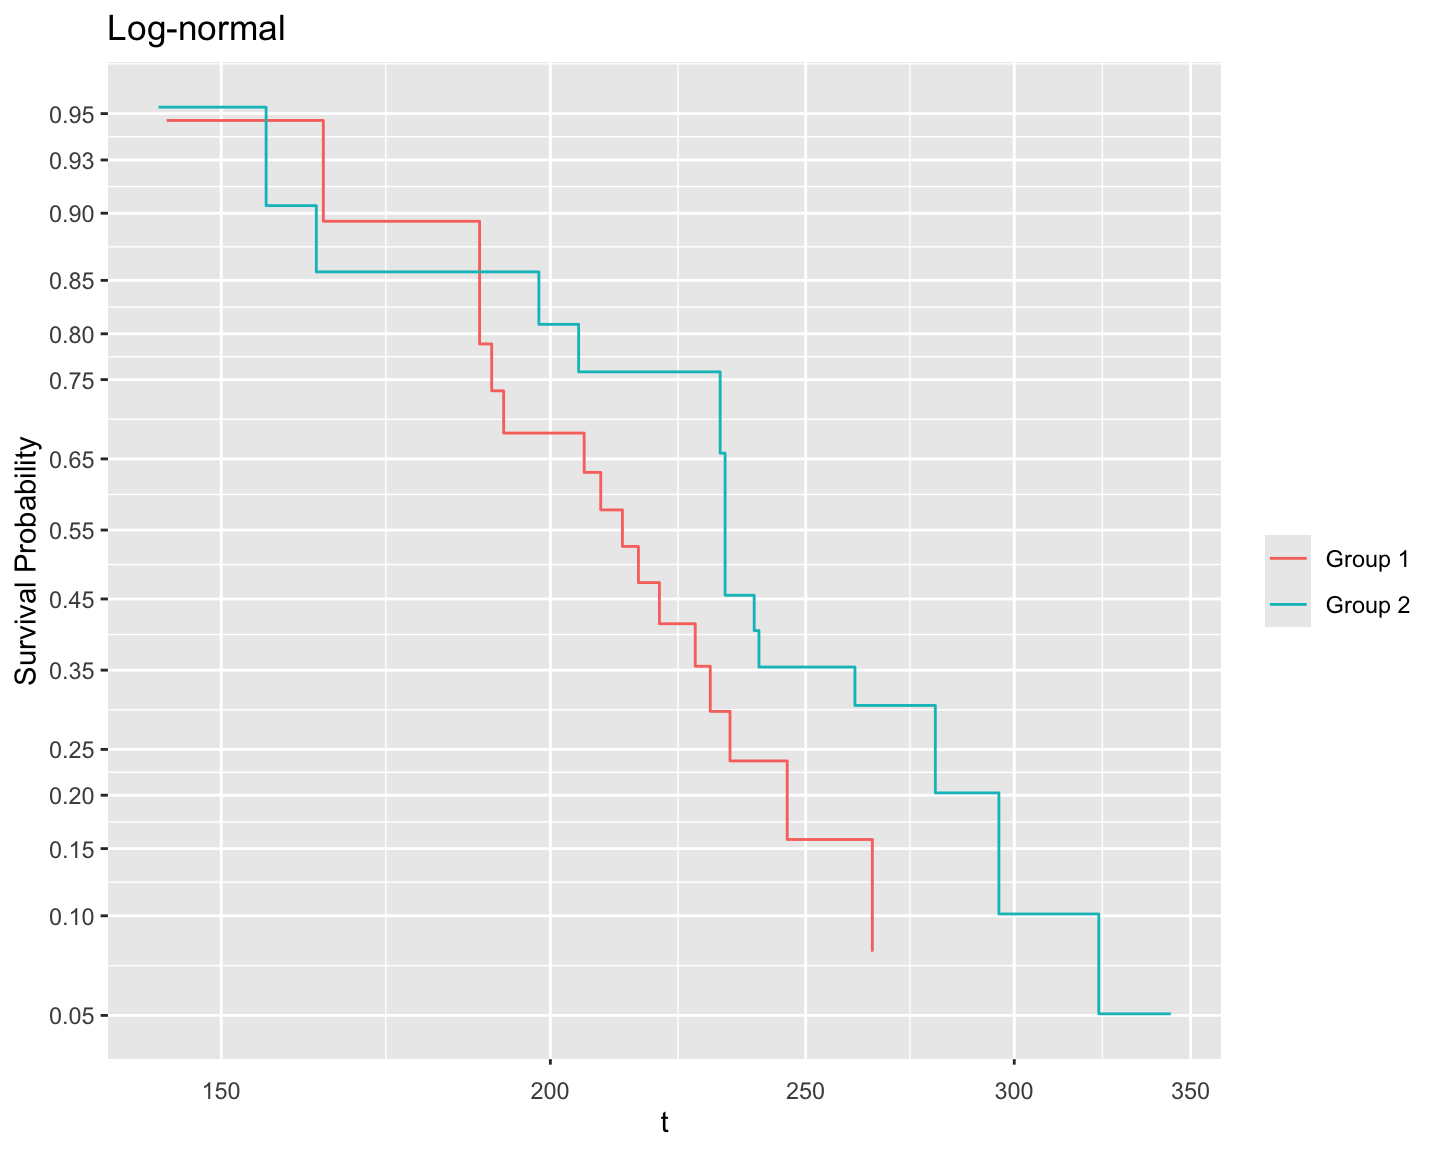
Fit Weibull (in aft form), log-logistic, and log-normal models.
Weibull default form :
\[[c]=1~\mathrm{if~subject~is~in~group}~c,~0~\mathrm{otherwise}\]
Weibull PH form :
\[[c]=1~\mathrm{if~subject~is~in~group}~c,~0~\mathrm{otherwise}\]
Log-logistic :
\[[c]=1~\mathrm{if~subject~is~in~group}~c,~0~\mathrm{otherwise}\]
Log-normal :
\[[c]=1~\mathrm{if~subject~is~in~group}~c,~0~\mathrm{otherwise}\]

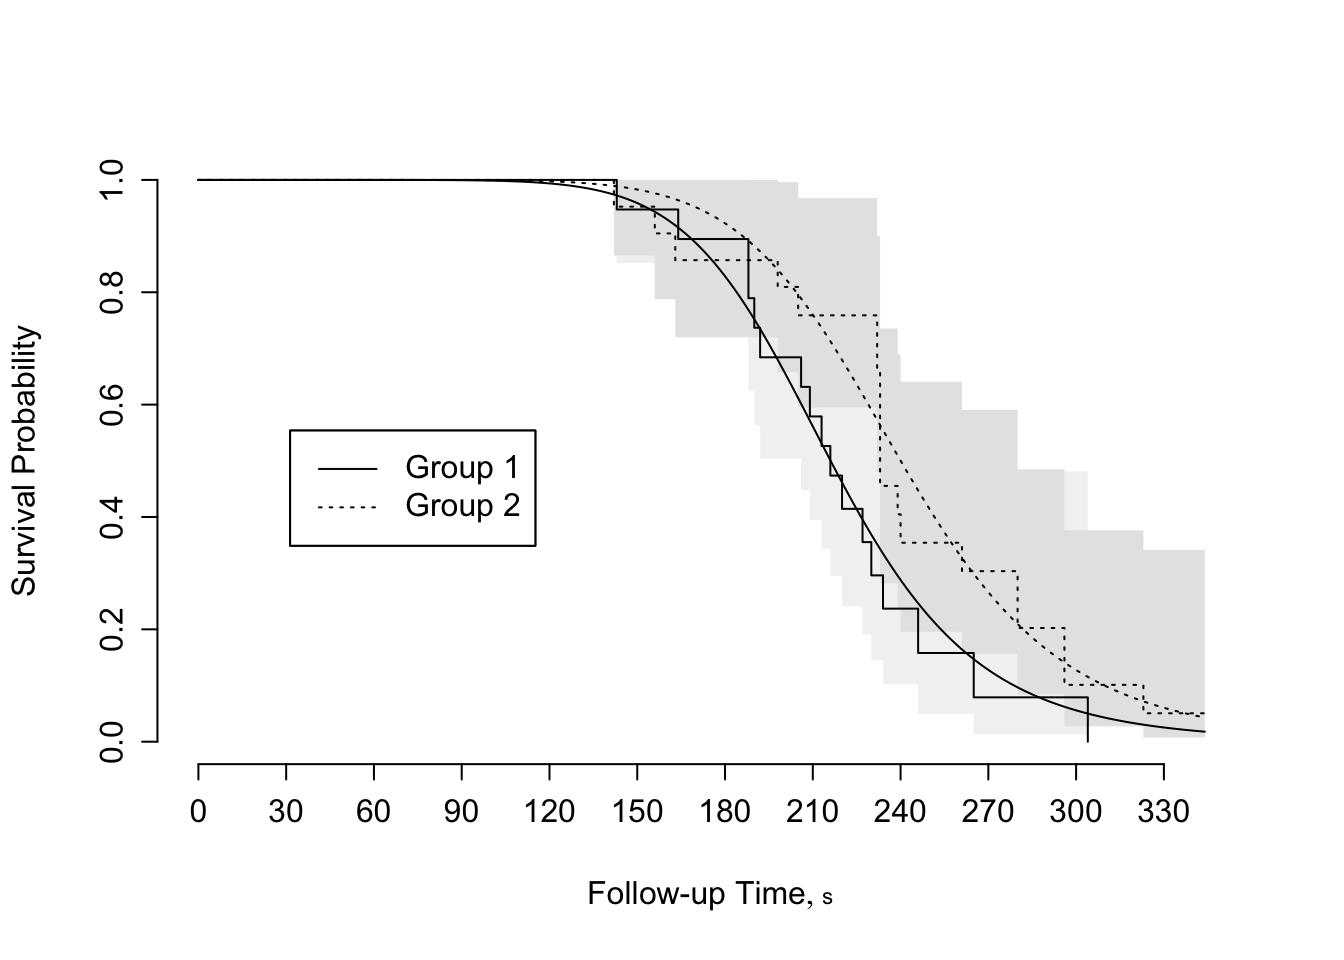
Let’s plot this another way
np <- summary(f)
np <- with(np, data.frame(group=strata, time, surv, lower, upper))
np$group <- substring(np$group, 7)
ll <- survplot(fl, group, conf.int=0.95, ggplot=TRUE, onlydata=TRUE)
w <- rbind(data.frame(method='KM', np),
data.frame(method='Log-logistic', ll))
# geom_stepconfint is in Hmisc
ggplot(w, aes(x=time, y=surv)) + geom_step(aes(color = method)) +
geom_stepconfint(aes(ymin=lower, ymax=upper, fill=method), alpha=0.15) +
facet_wrap(~ group) +
labs(x='Days', y='Survival Probability')
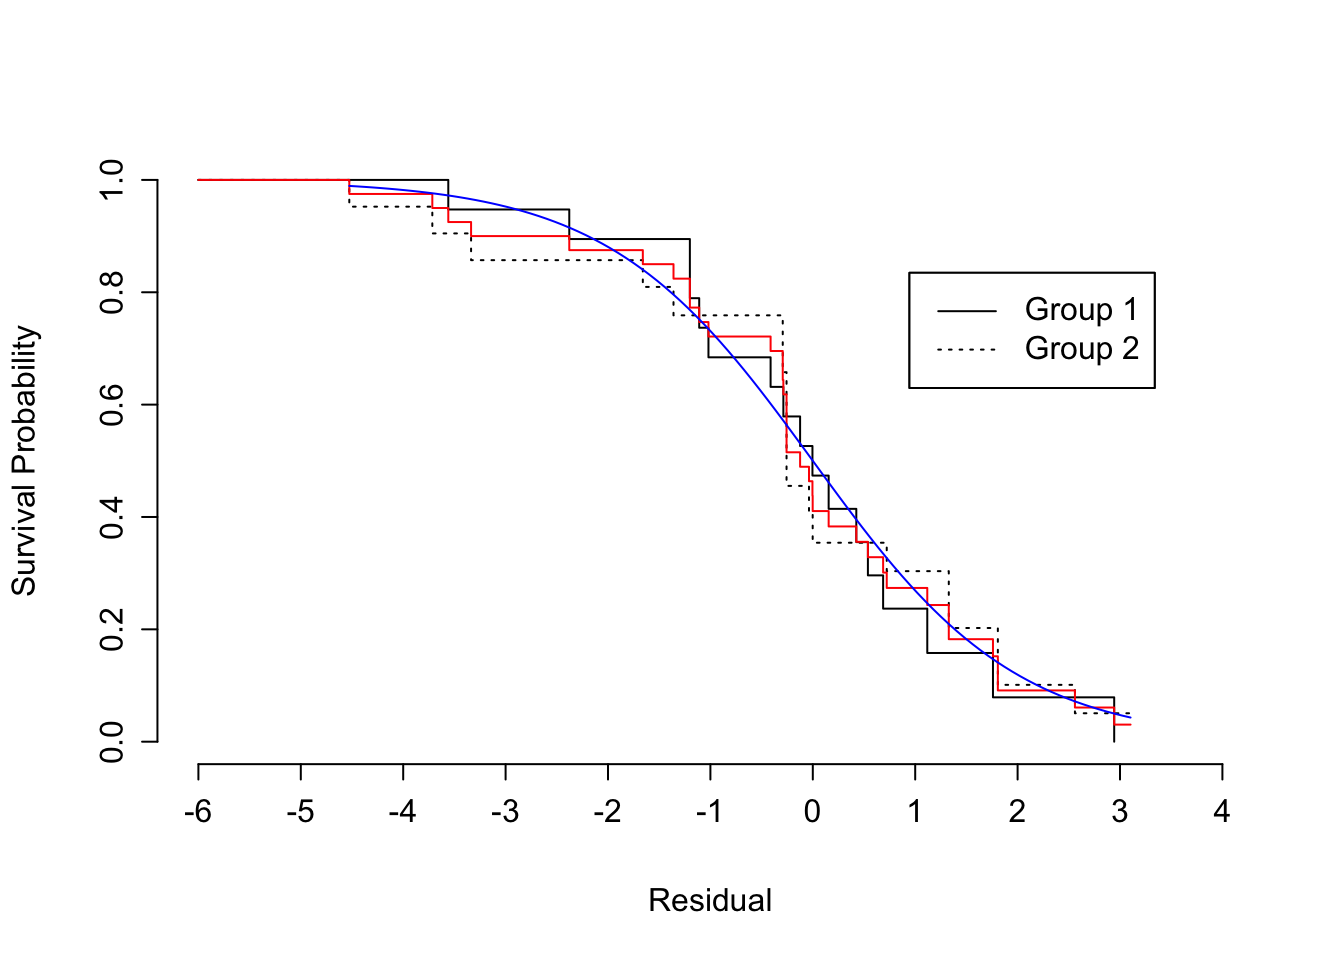
Now make a stringent assessment of the fit with respect to the distributional assumption of a parametric survival model.
Derive R code for median, mean, hazard, survival functions
function (q = 0.5, lp = NULL, parms = -2.15437773933124)
{
names(parms) <- NULL
f <- function(lp, q, parms) lp + exp(parms) * logb(q/(1 -
q))
names(q) <- format(q)
drop(exp(outer(lp, q, FUN = f, parms = parms)))
}
<environment: namespace:rms>function (lp = NULL, parms = -2.15437773933124)
{
names(parms) <- NULL
if (exp(parms) > 1)
rep(Inf, length(lp))
else exp(lp) * pi * exp(parms)/sin(pi * exp(parms))
}
<environment: namespace:rms>function (times = NA, lp = NULL, parms = -2.15437773933124)
{
t.trans <- logb(times)
t.deriv <- 1/times
scale <- exp(parms)
names(t.trans) <- format(times)
t.deriv/scale/(1 + exp(-(t.trans - lp)/scale))
}
<environment: namespace:rms>function (times = NULL, lp = NULL, parms = -2.15437773933124)
{
1/(1 + exp((logb(times) - lp)/exp(parms)))
}
<environment: namespace:rms>Show fitted hazard function from log-logistic, and add median survival time to graph
1 2
216.0857 240.0328 [1] 216.0857 240.0328 1 2
0.5612718 0.7599776 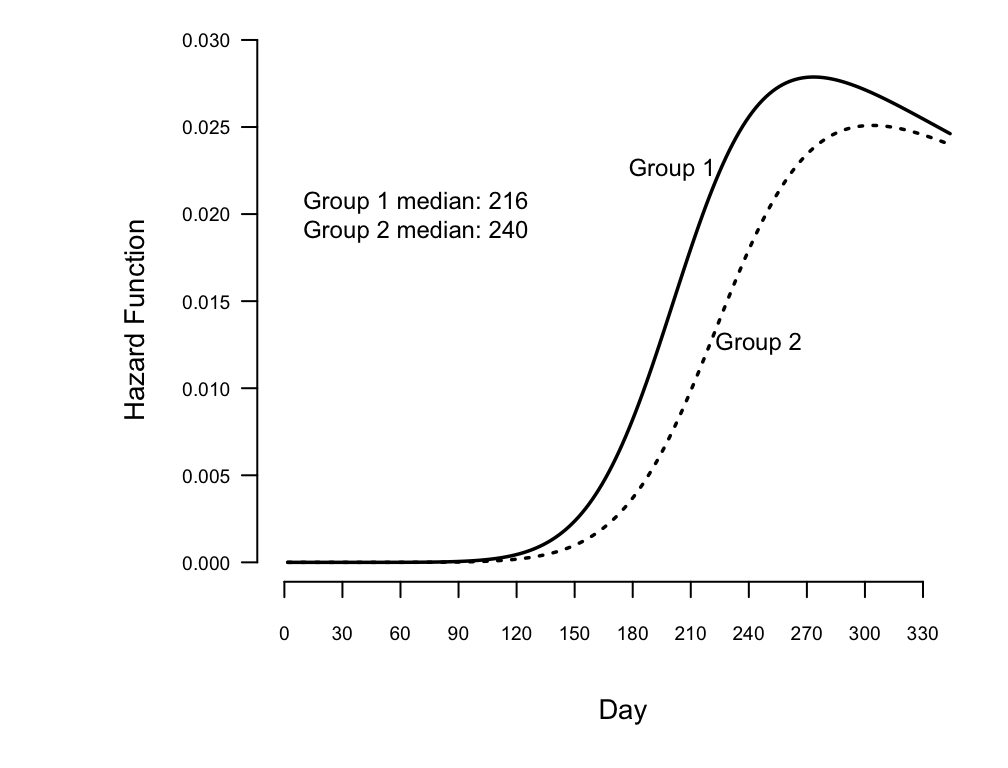
loess smooth of \(F(T | X) - 0.5 F(C | X)\) against \(X
\hat{\beta}\) or \(\frac{2 F(T | X)}{F(C | X)}\) vs. \(X \hat{\beta}\) if \(C\) is knownSee the val.surv function in the rms package.
R Functionssurvival package: survreg for Weibull, log-normal, log-logistic, etc.rms package: psm front-end for survregrstpm2 package: cran.r-project.org/web/packages/rstpm2 which has more general AFT modelsR packages:```{r include=FALSE}
require(Hmisc)
options(qproject='rms', prType='html')
require(qreport)
getRs('qbookfun.r')
hookaddcap()
knitr::set_alias(w = 'fig.width', h = 'fig.height', cap = 'fig.cap', scap ='fig.scap')
```
# Parametric Survival Models {#sec-parsurv}
## Homogeneous Models (No Predictors) {#sec-parsurv-homogeneous}
Why use a parametric model?
1. easily compute selected quantiles of the survival distribution
1. estimate (usually by extrapolation) the expected failure time
1. derive a concise equation and smooth function for estimating $S(t)$,
$\Lambda(t)$, and $\lambda(t)$
1. estimate $S(t)$ more precisely than $S_{\rm KM}(t)$ or
$S_{\Lambda}(t)$ (Altschuler-Nelson-Fleming-Harrington estimator)
if the parametric form is correctly specified.
**Note**: Fitting more than two smooth survival curves and
choosing the one that best reproduces the KM estimator will result in
a true precision no better than KM due to model uncertainty.
### Specific Models
* Seen exponential and Weibull already
* Many others obtained by assuming $\log(T)$ has a certain dist.
* Log-normal: $S(t) = 1 - \Phi(\frac{\log(t)-\mu}{\sigma})$
* Log-logistic: $S(t) = [1 + \exp(-\frac{\log(t)-\mu}{\sigma})]^{-1}$
* Log-extreme value: $S(t) = \exp[-\exp(\frac{\log(t)-\mu}{\sigma})]$ <br>
another way of expressing Weibull
### Estimation
* Log-likelihood for exponential distribution
$$
\log L = \sum_{i:Y_{i} {\rm\ uncensored}}^{n} \log \lambda -
\sum_{i=1}^{n} \lambda Y_{i}
$$
\begin{array}{ccc}
\hat{\lambda} &=& n_{u}/w \\
{\rm var}(\hat{\lambda}) &=& n_{u}/w^{2} \\
{\rm var}(\log \hat{\lambda}) &=& 1/n_{u} \\
\hat{\mu} &=& w/n_{u} \\
\hat{S}(t) &=& \exp(-\hat{\lambda}t)
\end{array}
Consider these failure time data:
\begin{array}{c}
1 \ \ 3\ \ 3\ \ 6^{+}\ \ 8^{+}\ \ 9\ \ 10^{+} . \nonumber
\end{array}
```{r samplefit}
require(rms)
S <- Surv(c(1, 3, 3, 6, 8, 9, 10), c(1,1,1,0,0,1,0))
fe <- psm(S ~ 1, dist='exponential')
f2 <- psm(S ~ 1, dist='weibull')
```
\begin{array}{ccc}
n_{u} &=& 4 \\
w &=& 40 \\
\hat{\mu} &=& 10 \pm 5 \\
T_{0.5} &=& 10 \log(2)
\end{array}
* Weibull fit
\begin{array}{ccc}
\hat{\alpha} &=& 0.0728 \nonumber \\
\hat{\gamma} &=& 1.164 \nonumber \\
\hat{S}(t) &=& \exp(-0.0728t^{1.164}) \\
\hat{S}^{-1}(0.5) &=& [(\log 2)/\hat{\alpha}]^{1/\hat{\gamma}} = 6.935 \\
{\rm (estimated\ median)} \nonumber
\end{array}
### Assessment of Model Fit {#sec-parsurv-assess-homog}
* Example: Weibull
$$
\log[-\log S(t)] = \log \Lambda(t) = \log \alpha +\gamma (\log t)
$$
* Plot
$\log \hat{\Lambda}(t)$ versus
$\log t$
* For assumed dist. $S(t)$ plot $S^{-1}[S_{\Lambda}(t)]$ or
$S^{-1}[S_{\rm KM}(t)]$ against $t$, check for linearity
* Log-distributions: plot vs. $\log t$
* Check log-normal: plot $\Phi^{-1}[S_{\Lambda}(t)]$ vs. $\log t$
* Check log-logistic: plot ${\rm logit}[S_{\Lambda}(t)]$ vs. $\log t$
* Alternative: plot fitted $\hat{S}(t)$ and $S_{\Lambda}(t)$ vs. $t$
on the same graph
## Parametric Proportional Hazards Models
### Model
$$
\lambda(t|X) = \lambda(t) \exp(X\beta)
$$
\begin{array}{ccc}
\Lambda(t|X) &=& \Lambda(t) \exp(X\beta) \nonumber \\
S(t|X) &=& \exp[-\Lambda(t)\exp(X\beta)] = \exp[-\Lambda(t)]^{\exp(X\beta)}
\end{array}
$$
S(t|X) = S(t)^{\exp(X\beta)} ,
$$
### Model Assumptions and Interpretation of Parameters {#sec-parsurv-pphassume}
\begin{array}{ccc}
\log \lambda(t|X) &=& \log \lambda(t)+X\beta \nonumber \\
\log \Lambda(t|X) &=& \log \Lambda(t)+X\beta
\end{array}
Assumptions:
* Underlying functions ($\lambda$, $\Lambda$, $S$)
* Linear effect of predictors on $\log\lambda$, $\log\Lambda$
* No interaction between $X$ and $t$ $\rightarrow$ impact same over time
\begin{array}{ccc}
\beta_{j} &=& \log \lambda(t|X_{1}, X_{2}, \ldots, X_{j}+1, X_{j+1}, \ldots, X_{k}) \\
&-& \log \lambda(t|X_{1}, \ldots, X_{j}, \ldots, X_{k}) ,
\end{array}
* Effect of increasing
$X_{j}$ by $d$ is to increase $\lambda$ by factor of $\exp(\beta_{j}d)$
* One binary predictor:
\begin{array}{ccc}
\lambda(t|X_{1}=0) &=& \lambda(t) \nonumber \\
\lambda(t|X_{1}=1) &=& \lambda(t)\exp(\beta_{1})
\end{array}
Here $\exp(\beta_{1})$ is the $X_{1}=1:X_{1}=0$ hazard
ratio.
* One continuous predictor:
$$
\lambda(t|X_{1}) = \lambda(t)\exp(\beta_{1}X)
$$
### Hazard Ratio, Risk Ratio, and Risk Difference
$S_{T}=S_{C}^{0.5}$
```{r out.width='65%',echo=FALSE}
#| fig-cap: "Mortality differences and ratios when hazard ratio is 0.5."
knitr::include_graphics('images/parsurv-hr-diff.png')
```
```{r w=6,h=4.5,scap='Absolute clinical benefit as a function of survival in a control subject and the relative benefit',cap='Absolute clinical benefit as a function of survival in a control subject and the relative benefit (hazard ratio). The hazard ratios are given for each curve.'}
#| label: fig-parsurv-hr-vs-surv
spar(bty='l')
plot(0, 0, type="n", xlab="Survival for Control Subject",
ylab="Improvement in Survival",
xlim=c(0,1), ylim=c(0,.7))
i <- 0
hr <- seq(.1, .9, by=.1)
for(h in hr) {
i <- i + 1
p <- seq(.0001, .9999, length=200)
p2 <- p^h
d <- p2 - p
lines(p, d, lty=i)
maxd <- max(d)
smax <- p[d==maxd]
text(smax,maxd+.02, format(h), cex=.6)
}
```
### Specific Models
* Exponential:
\begin{array}{ccc}
\lambda(t|X) &=& \lambda \exp(X\beta) \nonumber \\
S(t|X) &=& \exp[-\lambda t \exp(X\beta)] = \exp(-\lambda t)^{\exp(X\beta)}
\end{array}
\begin{array}{ccc}
E\{T|X\} &=& 1/[\lambda \exp(X\beta)] \nonumber \\
T_{0.5}|X &=& (\log 2)/[\lambda \exp(X\beta)]
\end{array}
* Weibull:
\begin{array}{ccc}
\lambda(t|X) &=& \alpha\gamma t^{\gamma-1} \exp(X\beta) \nonumber \\
\Lambda(t|X) &=& \alpha t^{\gamma} \exp(X\beta) \nonumber \nonumber \\
S(t|X) &=& \exp[-\alpha t^{\gamma} \exp(X\beta)] \\
&=& [\exp(-\alpha t^{\gamma})]^{\exp(X\beta)} \nonumber
\end{array}
$$
T_{0.5}|X=\{\log 2 / [\alpha \exp(X\beta)]\}^{1/\gamma} .
$$
For numerical reasons, re-write:
$$\begin{array}{ccc}
S(t|X) &=& \exp(-\Lambda(t|X)) , {\rm\ \ \ where} \nonumber \\
\Lambda(t|X) &=& \exp(\gamma \log t + X\beta)
\end{array}$$ {#eq-parsurv-weibull}
See also spline hazard models [@her90res; @her95res, @koo95haz] and
the generalized gamma distribution [@cox07par].
### Assessment of Model Fit
```{r out.width='85%',echo=FALSE}
#| label: fig-parsurv-ph-assumption-binary
#| fig-cap: "PH Model with one binary predictor. $Y$-axis is $\\log \\lambda(t)$ or $\\log \\Lambda(t)$. For $\\log \\Lambda(t)$, the curves must be non-decreasing. For $\\log \\lambda(t)$, they may be any shape."
#| fig-scap: "PH model with one binary predictor"
knitr::include_graphics('images/parsurv-ph-assumption-binary.png')
```
If $\lambda(t)$ is Weibull, the two
curves will be linear if $\log t$ is plotted instead of $t$ on the $x$-axis.
```{r out.width='85%',echo=FALSE}
#| label: fig-parsurv-ph-assumption-x
#| fig-cap: "PH model with one continuous predictor. $Y$-axis is $\\log \\lambda(t)$ or $\\log \\Lambda(t)$. For $\\log \\Lambda(t)$, drawn for $t_{2}>t_{1}$. The slope of each line is $\\beta_{1}$."
#| fig-scap: "PH model with one continuous predictor"
knitr::include_graphics('images/parsurv-ph-assumption-x.png')
```
```{r out.width='85%',echo=FALSE}
#| label: fig-parsurv-ph-assumption-t
#| fig-cap: "PH model with one continuous predictor. $Y$-axis is $\\log \\lambda(t)$ or $\\log \\Lambda(t)$. For $\\log \\lambda$, the functions need not be monotonic."
#| fig-scap: "PH model with one continuous predictor"
knitr::include_graphics('images/parsurv-ph-assumption-t.png')
```
```{r out.width='85%',echo=FALSE}
#| label: fig-parsurv-ph-assumption-x1x2
#| fig-cap: "Regression assumptions, linear additive PH or AFT model with two predictors. For PH, $Y$-axis is $\\log \\lambda(t)$ or $\\log \\Lambda(t)$ for a fixed $t$. For AFT, $Y$-axis is $\\log(T)$."
#| fig-scap: "Regression assumptions, linear additive PH or AFT model with two predictors"
knitr::include_graphics('images/parsurv-ph-assumption-x1x2.png')
```
* Weibull: Stratify on $X$, plot $\log \Lambda_{\rm KM}(t|X {\rm\ stratum})$ vs. $\log t$.
* Assesses PH in addition to shape assumptions--all
curves should be parallel as well as straight.
## Accelerated Failure Time Models
### Model
* Specifies that predictors act multiplicatively on failure time
* Alters rate subject proceeds along time axis
$$S(t|X) = \psi(\frac{\log(t)-X\beta}{\sigma})$$ {#eq-parsurv-accel}
\begin{array}{ccc}
\frac{\log(T)-X\beta}{\sigma} &\sim& \psi \\
\log(T) = X\beta + \sigma\epsilon \\
\epsilon \sim \psi
\end{array}
* Weibull (and exponential) members of PH and AFT
### Model Assumptions and Interpretation of Parameters
$$
\psi^{-1}(S(t|X)) = \frac{\log(t)-X\beta}{\sigma}
$$ {#eq-parsurv-aft-inv}
Letting $\epsilon \sim \psi$
$$
\log(T) = X\beta + \sigma\epsilon
$$
Check that residuals $\log(T)-X\hat{\beta} \sim \psi$ (within scale factor).
The assumptions of the AFT model are
thus
1. The true form of $\psi$ (the distributional family) is correctly specified.
1. In the absence of nonlinear and interaction terms, each $X_j$
affects $\log(T)$ or $\psi^{-1}(S(t|X))$ linearly.
1. Implicit in these assumptions is that $\sigma$ is a constant
independent of $X$.
1-unit change in $X_{j} = \beta_{j}$ change in $\log T$, or increase
$T$ by factor of $\exp(\beta_{j})$. <br>
Median survival time:
$$
T_{0.5}|X = \exp(X\beta + \sigma \psi^{-1}(0.5))
$$
### Specific Models
* Extreme value: $\psi(u)=\exp(-\exp(u))$
* Logistic: $\psi(u)=[1+\exp(u)]^{-1}$
* Normal: $\psi(u)=1 - \Phi(u)$
* Log-normal:
$$
S(t|X) = 1 - \Phi(\frac{\log(t)-X\beta}{\sigma}),
$$
* Log-logistic:
$$
S(t|X) = [1 + \exp(\frac{\log(t) - X\beta}{\sigma})]^{-1}.
$$
### Estimation
Works better if $\sigma$ parameterized as $\exp(\delta)$.
\begin{array}{ccc}
\hat{S}(t|X) &=& \psi(\frac{\log(t)-X\hat{\beta}}{\hat{\sigma}}) \nonumber \\
\hat{T}_{0.5}|X &=& \exp[X\hat{\beta} + \hat{\sigma} \psi^{-1}(0.5)].
\end{array}
Normal and logistic: $\hat{T}_{0.5}|X = \exp(X\hat{\beta})$
$$
\psi(\frac{\log(t)-X\hat{\beta}}{\hat{\sigma}}\pm z_{1-\alpha/2}\times s)
$$
### Residuals {#sec-parsurv-resid}
For an AFT model, standardized residuals are simply
$$
r = (\log(T)-X\hat{\beta})/\sigma
$$ {#eq-parsurv-resid}
When $T$ is right-censored, $r$ is right-censored.
### Assessment of Model Fit {#sec-parsurv-assess}
```{r out.width='85%',echo=FALSE}
#| label: fig-parsurv-aft-assumption-t
#| fig-cap: "AFT model with one predictor. $Y$-axis is $\\psi^{-1}(S(t|X)) = \\frac{\\log(t)-X\\beta}{\\sigma}$. Drawn for $d>c$. The slope of the lines is $\\sigma^{-1}$."
#| fig-scap: "AFT model with one predictor"
knitr::include_graphics('images/parsurv-aft-assumption-t.png')
```
```{r out.width='85%',echo=FALSE}
#| label: fig-parsurv-aft-assumption-x
#| fig-cap: "AFT model with one continuous predictor. $Y$-axis is $\\psi^{-1}(S(t|X)) = \\frac{\\log(t)-X\\beta}{\\sigma}$. Drawn for $t_{2}>t_{1}$. The slope of each line is $\\beta_{1}/\\sigma$ and the difference between the lines is $\\frac{1}{\\sigma}\\log(t_{2}/t_{1})$."
#| fig-scap: "AFT model with one continuous predictor"
knitr::include_graphics('images/parsurv-aft-assumption-x.png')
```
| |||||||||| |
|---------|----|---|----|----|----|----|----|----|----|-----|
| Group 1 |143 |164| 188| 188| 190| 192| 206| 209| 213| 216 |
| |220 |227| 230| 234| 246| 265| 304| 216$^{+}$| 244$^{+}$| |
| Group 2 |142 |156| 163| 198| 205| 232| 232| 233| 233| 233 |
| |233 |239| 240| 261| 280| 280| 296| 296| 323| 204$^{+}$ |
| |344$^{+}$ ||||||||| |
```{r h=6, w=7.5, scap='Examples of checking parametric survival model assumptions',cap='Altschuler-Nelson-Fleming-Harrington nonparametric survival estimates for rats treated with DMBA [@pik66met], along with various transformations of the estimates for checking distributional assumptions of 3 parametric survival models.'}
#| label: fig-parsurv-kprats-check
spar(mfrow=c(2,2), top=1, bot=2, mgp=c(2.75, .365, 0))
getHdata(kprats)
kprats$group <- factor(kprats$group, 0:1, c('Group 1', 'Group 2'))
dd <- datadist(kprats); options(datadist="dd")
S <- with(kprats, Surv(t, death))
f <- npsurv(S ~ group, type="fleming", data=kprats)
survplot(f, n.risk=TRUE, conf='none',
label.curves=list(keys='lines'), levels.only=TRUE)
title(sub="Nonparametric estimates", adj=0, cex=.7)
# Check fits of Weibull, log-logistic, log-normal
ggplot(f, trans='loglog', logt=TRUE, conf='none') +
labs(title='Weibull (extreme value)')
ggplot(f, trans='logit', logt=TRUE, conf='none') +
labs(title='Log-logistic')
ggplot(f, trans='probit', logt=TRUE, conf='none') +
labs(title='Log-normal')
```
Fit Weibull (in aft form), log-logistic, and log-normal models.
```{r fittedpsm}
fw <- psm(S ~ group, data=kprats, dist='weibull')
fl <- psm(S ~ group, data=kprats, dist='loglogistic',
          y=TRUE)
fn <- psm(S ~ group, data=kprats, dist='lognormal')
bld <- function(x) knitr::asis_output(paste0('**', x, '** :\n\n'))
bld('Weibull default form')
latex(fw)
bld('Weibull PH form')
latex(pphsm(fw))
bld('Log-logistic')
latex(fl)
bld('Log-normal')
latex(fn)
```
```{r out.width='75%',echo=FALSE}
#| fig-cap: "Group effects from three survival models"
knitr::include_graphics('images/parsurv-group-effects.png')
```
* More general approach to verifying distributional assumptions:
* Plot nonparametric estimate of survival distribution of $r$
* Superimpose theoretical standardized distribution
* Can get distribution of residuals separately by strata --- should
all have same standardized distribution (e.g., same $\sigma$)
```{r scap='Fitted log-logistic model',cap='Agreement between fitted log-logistic model and nonparametric survival estimates for rat vaginal cancer data'}
#| label: fig-parsurv-kprats-psm-np
survplot(f, conf.int=FALSE,
         levels.only=TRUE, label.curves=list(keys='lines'))
survplot(fl, add=TRUE, label.curves=FALSE, conf.int=FALSE)
```
<!-- NEW -->
Let's plot this another way
```{r}
np <- summary(f)
np <- with(np, data.frame(group=strata, time, surv, lower, upper))
np$group <- substring(np$group, 7)
ll <- survplot(fl, group, conf.int=0.95, ggplot=TRUE, onlydata=TRUE)
w <- rbind(data.frame(method='KM', np),
           data.frame(method='Log-logistic', ll))
# geom_stepconfint is in Hmisc
ggplot(w, aes(x=time, y=surv)) + geom_step(aes(color = method)) +
  geom_stepconfint(aes(ymin=lower, ymax=upper, fill=method), alpha=0.15) +
  facet_wrap(~ group) +
  labs(x='Days', y='Survival Probability')
```
Now make a stringent assessment of the fit with respect to the distributional assumption of a parametric survival model.
```{r scap='Checking AFT distributional assumption using residuals',cap='Kaplan-Meier estimates of distribution of standardized, censored residuals from the log-logistic model, along with the assumed standard log-logistic distribution (blue). Red step function is the estimated distribution of all residuals; black step functions are the estimated distributions of residuals stratified by group, as indicated.'}
#| label: fig-parsurv-kprats-resid-np
r <- resid(fl, 'cens')
survplot(npsurv(r ~ group, data=kprats),
         conf='none', xlab='Residual',
         label.curves=list(keys='lines'), levels.only=TRUE)
survplot(npsurv(r ~ 1), conf='none', add=TRUE, col='red')
lines(r, lwd=1, col='blue')
```
Derive `R` code for median, mean, hazard, survival functions
```{r kprats-Functions}
med   <- Quantile(fl)
med
meant <- Mean(fl)
meant
haz   <- Hazard(fl)
haz
surv  <- Survival(fl)
surv
```
Show fitted hazard function from log-logistic, and add median survival
time to graph
```{r w=5.25,h=4,scap='Estimated log-logistic hazard functions',cap='Estimated hazard functions for log-logistic fit to rat vaginal cancer data, along with median survival times'}
#| label: fig-parsurv-kprats-hazard
spar(ps=9,top=1,bot=1,left=1,mgp=c(2.75,.365,0))
# Plot estimated hazard functions and add median
# survival times to graph
survplot(fl, group, what="hazard")
# Compute median survival time
m <- med(lp=predict(fl,
           data.frame(group=levels(kprats$group))))
m
med(lp=range(fl$linear.predictors))
m <- format(m, digits=3)
text(68, .02, paste("Group 1 median: ", m[1],"\n",
                    "Group 2 median: ", m[2], sep=""))
# Compute survival probability at 210 days
xbeta <- predict(fl,
                 data.frame(group=c("Group 1","Group 2")))
surv(210, xbeta)
```
### Validating the Fitted Model {#sec-parsurv-validate}
* Check distributional shape
* Group predicted $t$-year survival and plot Kaplan-Meier estimate
at $t$ vs. mean predicted $\hat{S}$
* Cox-Snell residuals --- check against $U[0,1]$
* `loess` smooth of $F(T | X) - 0.5 F(C | X)$ against $X
\hat{\beta}$ or $\frac{2 F(T | X)}{F(C | X)}$ vs. $X \hat{\beta}$
if $C$ is known
See the `val.surv` function in the `rms` package.
## `R` Functions {#sec-parsurv-r}
* `survival` package: `survreg` for Weibull, log-normal, log-logistic, etc.
* `rms` package: `psm` front-end for `survreg`
* `rstpm2` package: [cran.r-project.org/web/packages/rstpm2](https://cran.r-project.org/web/packages/rstpm2) which has more general AFT models
* Many other `R` packages:<br> [cran.r-project.org/web/views/Survival.html](https://cran.r-project.org/web/views/Survival.html)
```{r echo=FALSE}
saveCap('18')
```