12  Logistic Model Case Study: Survival of Titanic Passengers

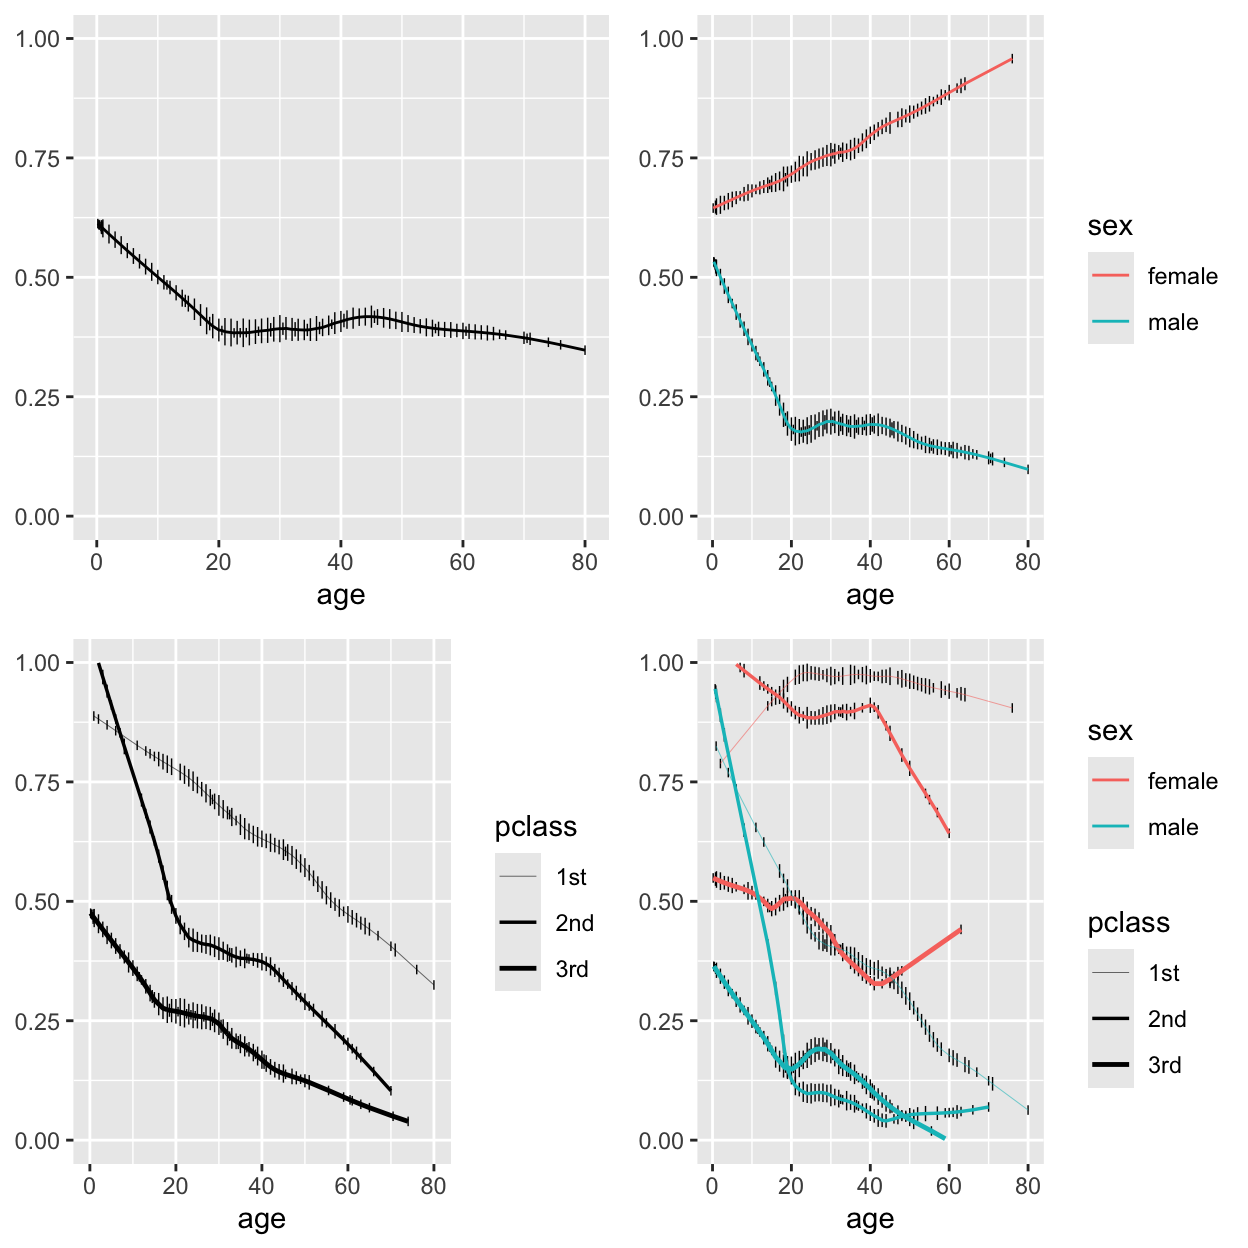
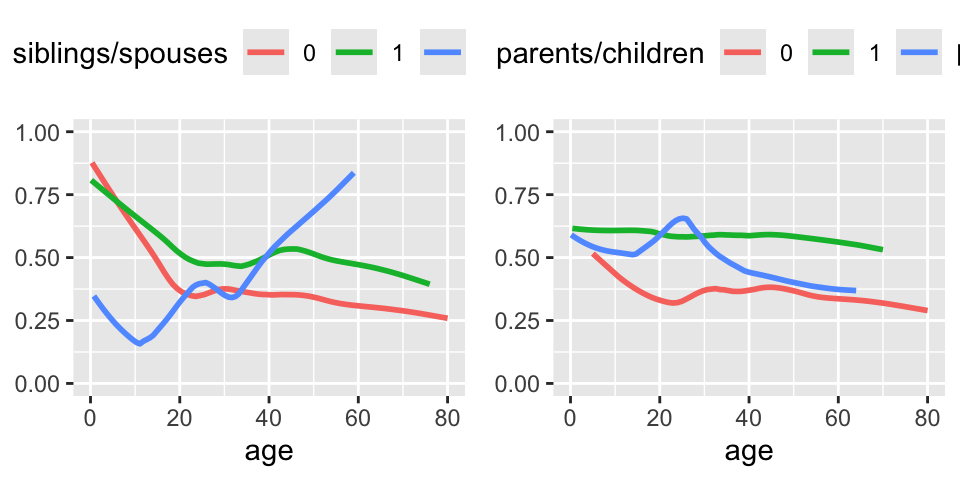
Data source: The Titanic Passenger List edited by Michael A. Findlay, originally published in Eaton & Haas (1994) Titanic: Triumph and Tragedy, Patrick Stephens Ltd, and expanded with the help of the Internet community. The original html files were obtained from Philip Hind (1999). The dataset was compiled and interpreted by Thomas Cason. It is available in R and spreadsheet formats from hbiostat.org/data under the name titanic3.

12.1 Descriptive Statistics

Code
require(rms)
options(prType='html')   # for print, summary, anova
getHdata(titanic3)        # get dataset from web site
# List of names of variables to analyze
v <- c('pclass','survived','age','sex','sibsp','parch')
t3 <- titanic3[, v]
units(t3$age) <- 'years'
describe(t3)
t3 Descriptives
t3

6 Variables   1309 Observations

pclass
image
nmissingdistinct
130903
 Value        1st   2nd   3rd
 Frequency    323   277   709
 Proportion 0.247 0.212 0.542 

survived: Survived
nmissingdistinctInfoSumMean
1309020.7085000.382

age: Age years
image
nmissingdistinctInfoMeanpMedianGmd.05.10.25.50.75.90.95
1046263980.99929.882916.06 5142128395057
lowest : 0.1667 0.3333 0.4167 0.6667 0.75 , highest: 70.5 71 74 76 80
sex
nmissingdistinct
130902
 Value      female   male
 Frequency     466    843
 Proportion  0.356  0.644 

sibsp: Number of Siblings/Spouses Aboard
image
nmissingdistinctInfoMeanpMedianGmd
1309070.670.49890.50.777
 Value          0     1     2     3     4     5     8
 Frequency    891   319    42    20    22     6     9
 Proportion 0.681 0.244 0.032 0.015 0.017 0.005 0.007 
For the frequency table, variable is rounded to the nearest 0
parch: Number of Parents/Children Aboard
image
nmissingdistinctInfoMeanpMedianGmd
1309080.5490.38500.6375
 Value          0     1     2     3     4     5     6     9
 Frequency   1002   170   113     8     6     6     2     2
 Proportion 0.765 0.130 0.086 0.006 0.005 0.005 0.002 0.002 
For the frequency table, variable is rounded to the nearest 0
Code
spar(ps=6,rt=3)
dd <- datadist(t3)
# describe distributions of variables to rms
options(datadist='dd')
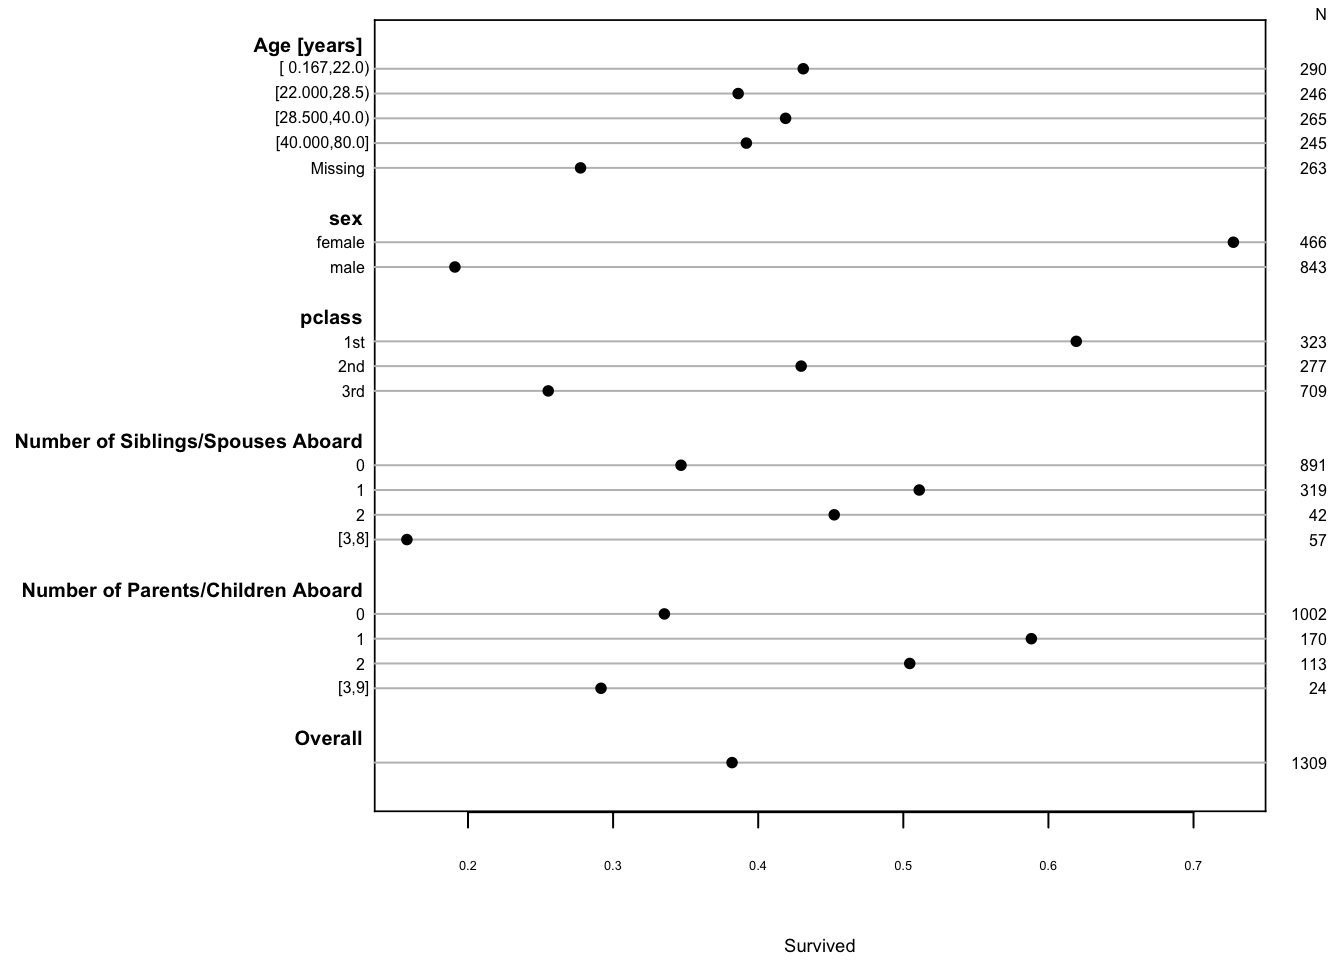
s <- summary(survived ~ age + sex + pclass +
             cut2(sibsp,0:3) + cut2(parch,0:3), data=t3)
plot(s, main='', subtitles=FALSE)
Figure 12.1: Univariable summaries of Titanic survival

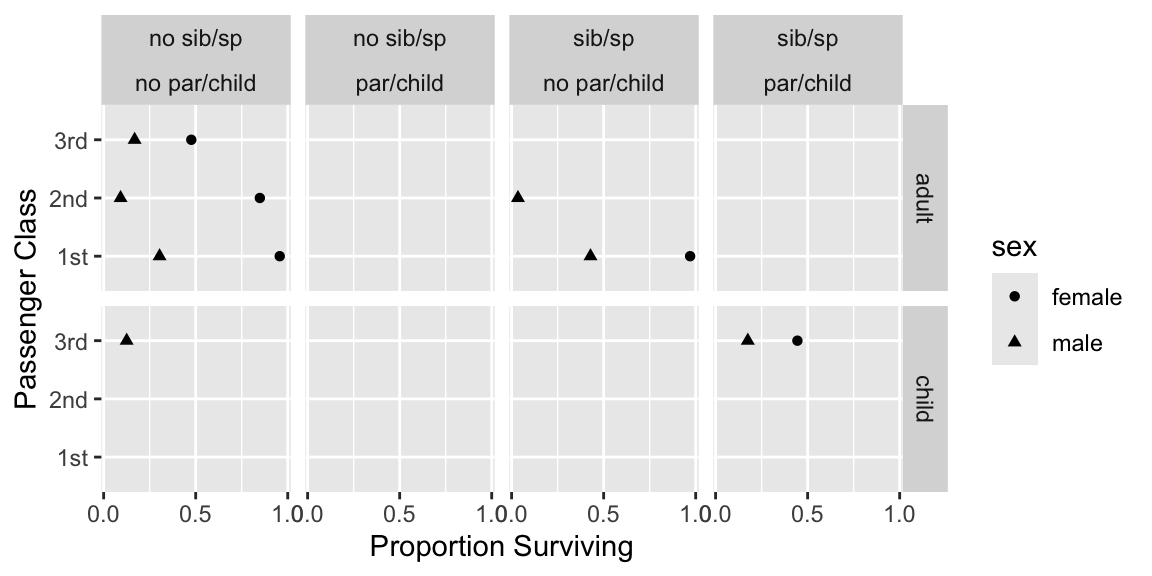
Show 4-way relationships after collapsing levels. Suppress estimates based on \(<25\) passengers.

A
Code
require(ggplot2)
tn <- transform(t3,
  agec = ifelse(age < 21, 'child', 'adult'),
  sibsp= ifelse(sibsp == 0, 'no sib/sp', 'sib/sp'),
  parch= ifelse(parch == 0, 'no par/child', 'par/child'))
g <- function(y) if(length(y) < 25) NA else mean(y)
s <- with(tn, summarize(survived,
           llist(agec, sex, pclass, sibsp, parch), g))
# llist, summarize in Hmisc package
ggplot(subset(s, agec != 'NA'),
  aes(x=survived, y=pclass, shape=sex)) +
  geom_point() + facet_grid(agec ~ sibsp * parch) +
  xlab('Proportion Surviving') + ylab('Passenger Class') +
  scale_x_continuous(breaks=c(0, .5, 1))
Figure 12.2: Multi-way summary of Titanic survival

12.3 Binary Logistic Model with Casewise Deletion of Missing Values

  • First fit a model that is saturated with respect to age, sex, pclass
  • Insufficient variation in sibsp, parch to fit complex interactions or nonlinearities.
  • With age appearing in so many terms, giving too many parameters to age creates instabilities and makes many bootstrap repetitions fail to converge or to yield singular covariance matrices
  • Use AIC to determine the global number of knots for age that is “best for the money” in terms of being the most likely to cross-validate well
Code
for(k in 3 : 5) {
  f <- lrm(survived ~ sex*pclass*rcs(age, k) +
           rcs(age, k)*(sibsp + parch), data=t3)
  cat('k=', k, '  AIC=', AIC(f), '\n')
}
k= 3   AIC= 922.9147 
k= 4   AIC= 916.6481 
k= 5   AIC= 921.2103 
  • 4 knots has best (lowest) AIC and we’ll use that going forward
  • Refit that model with x=TRUE, y=TRUE so can do likelihood ratio (LR) tests
  • But start with Wald tests
Code
f1 <- lrm(survived ~ sex*pclass*rcs(age,4) +
          rcs(age,4)*(sibsp + parch), data=t3, x=TRUE, y=TRUE)
print(f1, r2=1:4)   # print all 4 R^2 measures that use only the global LR chi-square

Logistic Regression Model

lrm(formula = survived ~ sex * pclass * rcs(age, 4) + rcs(age, 
    4) * (sibsp + parch), data = t3, x = TRUE, y = TRUE)
Frequencies of Missing Values Due to Each Variable
survived      sex   pclass      age    sibsp    parch 
       0        0        0      263        0        0 
Model Likelihood
Ratio Test
Discrimination
Indexes
Rank Discrim.
Indexes
Obs 1046 LR χ2 561.97 R21046 0.416 C 0.876
0 619 d.f. 31 R231,1046 0.398 Dxy 0.748
1 427 Pr(>χ2) <0.0001 R2758.1 0.524 γ 0.753
max |∂log L/∂β| 4×10⁻⁸ R231,758.1 0.504 τa 0.363
Brier 0.129
β S.E. Wald Z Pr(>|Z|)
Intercept   -2.2942  3.4139 -0.67 0.5016
sex=male   6.3349  4.2247 1.50 0.1337
pclass=2nd   14.3545  8.4676 1.70 0.0900
pclass=3rd   3.5271  3.2329 1.09 0.2753
age   0.3671  0.2187 1.68 0.0932
age'   -0.8270  0.5684 -1.45 0.1457
age''   2.9159  2.3083 1.26 0.2065
sibsp   -0.8241  0.3173 -2.60 0.0094
parch   0.2397  0.7406 0.32 0.7462
sex=male × pclass=2nd  -13.7220  9.0536 -1.52 0.1296
sex=male × pclass=3rd   -6.3991  4.3000 -1.49 0.1367
sex=male × age   -0.5937  0.2582 -2.30 0.0215
sex=male × age'   1.2395  0.6406 1.93 0.0530
sex=male × age''   -4.3891  2.5546 -1.72 0.0858
pclass=2nd × age   -0.9460  0.4793 -1.97 0.0484
pclass=3rd × age   -0.4106  0.2097 -1.96 0.0502
pclass=2nd × age'   2.2112  1.0827 2.04 0.0411
pclass=3rd × age'   0.7450  0.5632 1.32 0.1859
pclass=2nd × age''   -8.5918  4.1622 -2.06 0.0390
pclass=3rd × age''   -2.0708  2.3726 -0.87 0.3828
age × sibsp   0.0035  0.0277 0.13 0.9005
age' × sibsp   0.1309  0.1076 1.22 0.2237
age'' × sibsp   -0.7549  0.5438 -1.39 0.1651
age × parch   0.0145  0.0468 0.31 0.7558
age' × parch   -0.1092  0.1262 -0.87 0.3869
age'' × parch   0.5123  0.5365 0.95 0.3396
sex=male × pclass=2nd × age   0.7994  0.5140 1.56 0.1199
sex=male × pclass=3rd × age   0.4755  0.2641 1.80 0.0718
sex=male × pclass=2nd × age'   -1.9165  1.1706 -1.64 0.1016
sex=male × pclass=3rd × age'   -0.7422  0.6754 -1.10 0.2719
sex=male × pclass=2nd × age''   7.6432  4.5357 1.69 0.0920
sex=male × pclass=3rd × age''   1.1688  2.8864 0.40 0.6855
Code
anova(f1)
Wald Statistics for survived
χ2 d.f. P
sex (Factor+Higher Order Factors) 187.59 12 <0.0001
All Interactions 60.55 11 <0.0001
pclass (Factor+Higher Order Factors) 100.33 16 <0.0001
All Interactions 47.44 14 <0.0001
age (Factor+Higher Order Factors) 61.35 24 <0.0001
All Interactions 37.51 21 0.0147
Nonlinear (Factor+Higher Order Factors) 28.15 16 0.0303
sibsp (Factor+Higher Order Factors) 20.38 4 0.0004
All Interactions 11.84 3 0.0080
parch (Factor+Higher Order Factors) 3.79 4 0.4349
All Interactions 3.79 3 0.2848
sex × pclass (Factor+Higher Order Factors) 43.72 8 <0.0001
sex × age (Factor+Higher Order Factors) 14.39 9 0.1093
Nonlinear (Factor+Higher Order Factors) 12.54 6 0.0510
Nonlinear Interaction : f(A,B) vs. AB 4.95 2 0.0843
pclass × age (Factor+Higher Order Factors) 18.59 12 0.0989
Nonlinear (Factor+Higher Order Factors) 15.56 8 0.0492
Nonlinear Interaction : f(A,B) vs. AB 9.22 4 0.0559
age × sibsp (Factor+Higher Order Factors) 11.84 3 0.0080
Nonlinear 2.22 2 0.3302
Nonlinear Interaction : f(A,B) vs. AB 2.22 2 0.3302
age × parch (Factor+Higher Order Factors) 3.79 3 0.2848
Nonlinear 1.02 2 0.5994
Nonlinear Interaction : f(A,B) vs. AB 1.02 2 0.5994
sex × pclass × age (Factor+Higher Order Factors) 11.24 6 0.0813
Nonlinear 10.12 4 0.0385
TOTAL NONLINEAR 28.15 16 0.0303
TOTAL INTERACTION 77.40 23 <0.0001
TOTAL NONLINEAR + INTERACTION 80.04 25 <0.0001
TOTAL 243.00 31 <0.0001

Compute the slightly more time-consuming LR tests

Code
af1 <- anova(f1, test='LR')
print(af1, which='subscripts')
Likelihood Ratio Statistics for survived
χ2 d.f. P Tested
sex (Factor+Higher Order Factors) 339.48 12 <0.0001 1,9-13,26-31
All Interactions 76.17 11 <0.0001 9-13,26-31
pclass (Factor+Higher Order Factors) 154.71 16 <0.0001 2-3,9-10,14-19,26-31
All Interactions 64.95 14 <0.0001 9-10,14-19,26-31
age (Factor+Higher Order Factors) 109.11 24 <0.0001 4-6,11-31
All Interactions 53.85 21 0.0001 11-31
Nonlinear (Factor+Higher Order Factors) 37.75 16 0.0016 5-6,12-13,16-19,21-22,24-25,28-31
sibsp (Factor+Higher Order Factors) 26.75 4 <0.0001 7,20-22
All Interactions 12.10 3 0.0070 20-22
parch (Factor+Higher Order Factors) 3.96 4 0.4109 8,23-25
All Interactions 3.95 3 0.2666 23-25
sex × pclass (Factor+Higher Order Factors) 54.58 8 <0.0001 9-10,26-31
sex × age (Factor+Higher Order Factors) 19.68 9 0.0200 11-13,26-31
Nonlinear (Factor+Higher Order Factors) 16.43 6 0.0116 12-13,28-31
Nonlinear Interaction : f(A,B) vs. AB 7.76 2 0.0206 12-13
pclass × age (Factor+Higher Order Factors) 27.45 12 0.0066 14-19,26-31
Nonlinear (Factor+Higher Order Factors) 22.59 8 0.0039 16-19,28-31
Nonlinear Interaction : f(A,B) vs. AB 12.97 4 0.0114 16-19
age × sibsp (Factor+Higher Order Factors) 12.10 3 0.0070 20-22
Nonlinear 2.26 2 0.3224 21-22
Nonlinear Interaction : f(A,B) vs. AB 2.26 2 0.3224 21-22
age × parch (Factor+Higher Order Factors) 3.95 3 0.2666 23-25
Nonlinear 1.03 2 0.5990 24-25
Nonlinear Interaction : f(A,B) vs. AB 1.03 2 0.5990 24-25
sex × pclass × age (Factor+Higher Order Factors) 14.94 6 0.0207 26-31
Nonlinear 14.00 4 0.0073 28-31
TOTAL NONLINEAR 37.75 16 0.0016 5-6,12-13,16-19,21-22,24-25,28-31
TOTAL INTERACTION 107.47 23 <0.0001 9-31
TOTAL NONLINEAR + INTERACTION 117.47 25 <0.0001 5-6,9-31
TOTAL 561.97 31 <0.0001 1-31
  • In the RMS text, 5 knots were used for age and only Wald tests were performed
  • Large \(p\)-value for the 3rd order interaction was used to justify exclusion of these highest-order interactions from the model (and one other term)
  • More evidence for 3rd order interaction from the more accurate LR test
  • Keep this model

Show the many effects of predictors.

B
Code
p <- Predict(f1, age, sex, pclass, sibsp=0, parch=0, fun=plogis)
ggplot(p)
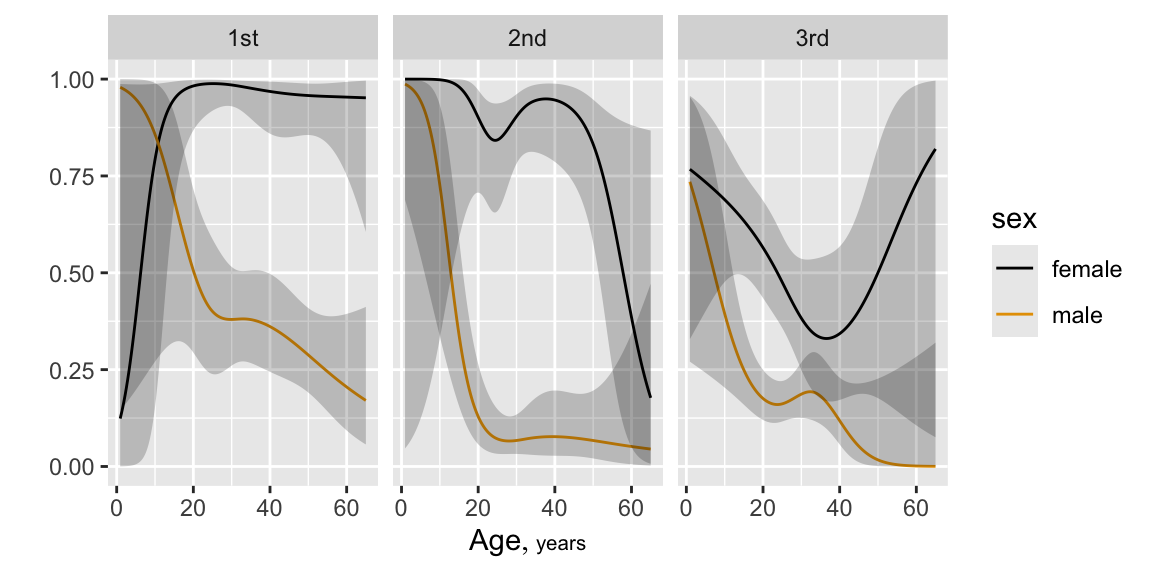
Figure 12.5: Effects of predictors on probability of survival of Titanic passengers, estimated for zero siblings/spouses and zero parents/children
Code
ggplot(Predict(f1, sibsp, age=c(10,15,20,50), conf.int=FALSE))
#
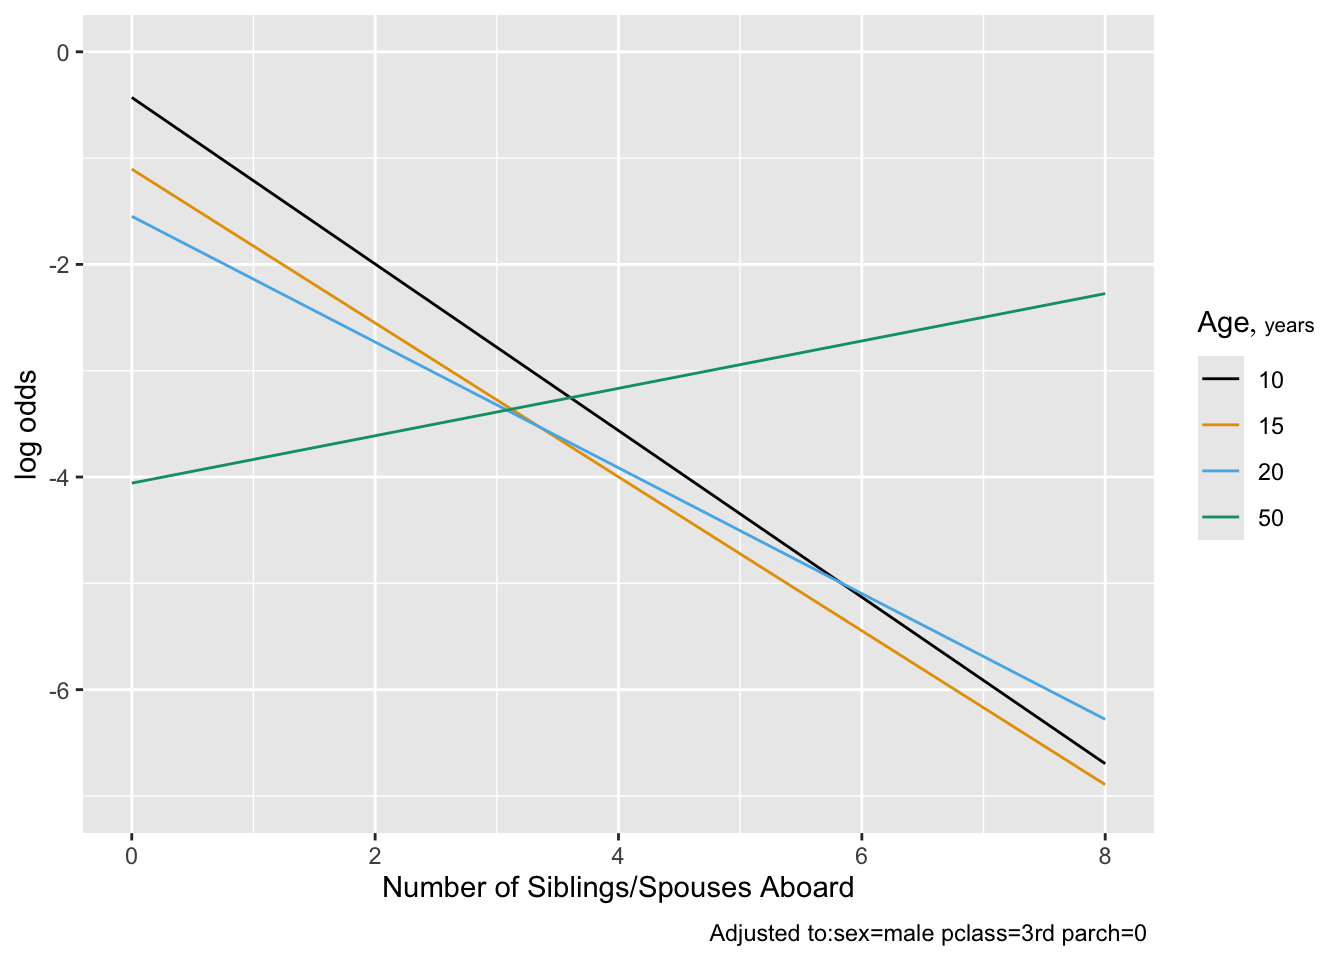
Figure 12.6: Effect of number of siblings and spouses on the log odds of surviving, for third class males

Note that children having many siblings apparently had lower survival. Married adults had slightly higher survival than unmarried ones.

C

But moderate problem with missing data must be dealt with

12.4 Examining Missing Data Patterns

Code
spar(mfrow=c(2,2), top=1, ps=11)
na.patterns <- naclus(titanic3)
require(rpart)      # Recursive partitioning package
who.na <- rpart(is.na(age) ~ sex + pclass + survived +
                sibsp + parch, data=titanic3, minbucket=15)
naplot(na.patterns, 'na per var')
plot(who.na, margin=.1); text(who.na)
plot(na.patterns)
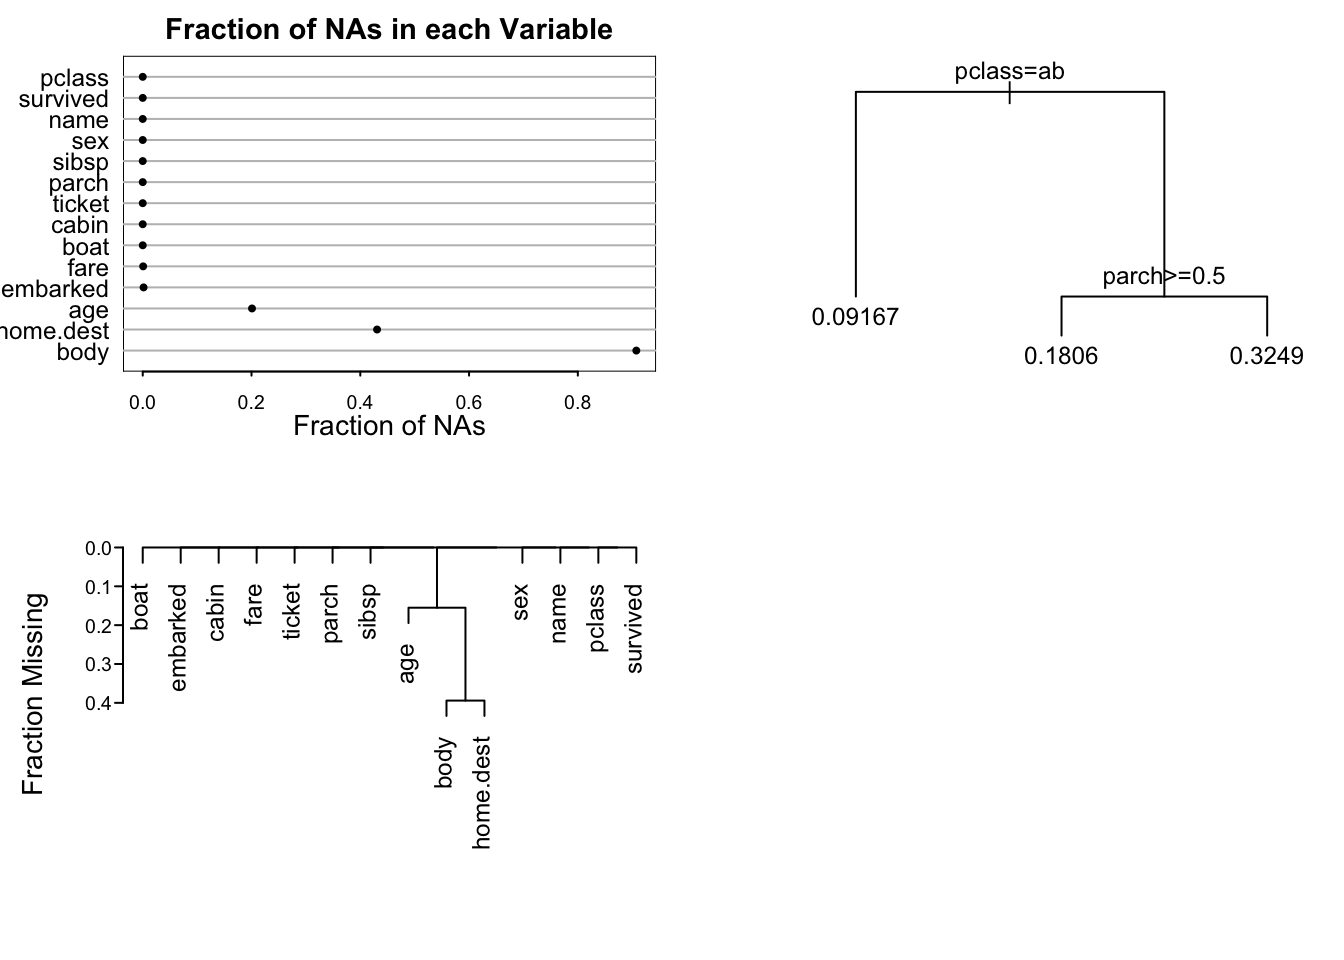
Figure 12.7: Patterns of missing data. Upper left panel shows the fraction of observations missing on each predictor. Lower panel depicts a hierarchical cluster analysis of missingness combinations. The similarity measure shown on the \(Y\)-axis is the fraction of observations for which both variables are missing. Right panel shows the result of recursive partitioning for predicting is.na(age). The rpart function found only strong patterns according to passenger class.
Code
spar(ps=7, rt=3)
plot(summary(is.na(age) ~ sex + pclass + survived +
             sibsp + parch, data=t3))
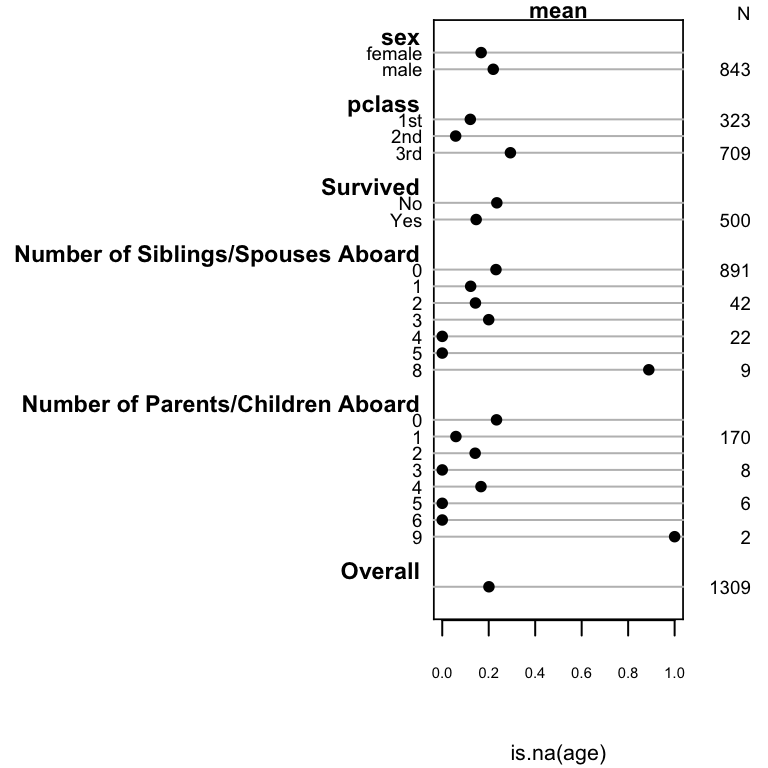
Figure 12.8: Univariable descriptions of proportion of passengers with missing age

But models almost always provide better descriptive statistics

Code
m <- lrm(is.na(age) ~ sex * pclass + survived + sibsp + parch,
         data=t3)
m

Logistic Regression Model

lrm(formula = is.na(age) ~ sex * pclass + survived + sibsp + 
    parch, data = t3)
Model Likelihood
Ratio Test
Discrimination
Indexes
Rank Discrim.
Indexes
Obs 1309 LR χ2 114.99 R2 0.133 C 0.703
FALSE 1046 d.f. 8 R28,1309 0.078 Dxy 0.353
TRUE 263 Pr(>χ2) <0.0001 R28,630.5 0.156 γ 0.451
max |∂log L/∂β| 5×10⁻⁶ Brier 0.148 τa 0.131
β S.E. Wald Z Pr(>|Z|)
Intercept  -2.2030  0.3641 -6.05 <0.0001
sex=male   0.6440  0.3953 1.63 0.1033
pclass=2nd  -1.0079  0.6658 -1.51 0.1300
pclass=3rd   1.6124  0.3596 4.48 <0.0001
survived  -0.1806  0.1828 -0.99 0.3232
sibsp   0.0435  0.0737 0.59 0.5548
parch  -0.3526  0.1253 -2.81 0.0049
sex=male × pclass=2nd   0.1347  0.7545 0.18 0.8583
sex=male × pclass=3rd  -0.8563  0.4214 -2.03 0.0422
Code
anova(m)
Wald Statistics for is.na(age)
χ2 d.f. P
sex (Factor+Higher Order Factors) 5.61 3 0.1324
All Interactions 5.58 2 0.0614
pclass (Factor+Higher Order Factors) 68.43 4 <0.0001
All Interactions 5.58 2 0.0614
survived 0.98 1 0.3232
sibsp 0.35 1 0.5548
parch 7.92 1 0.0049
sex × pclass (Factor+Higher Order Factors) 5.58 2 0.0614
TOTAL 82.90 8 <0.0001

pclass and parch are the important predictors of missing age.

12.5 Single Conditional Mean Imputation

Single imputation is not the preferred approach here. Click below to see this section.

First try: conditional mean imputation
Default spline transformation for age caused distribution of imputed values to be much different from non-imputed ones; constrain to linear. Also force discrete numeric variables to be linear because knots are hard to determine for them.

Code
xtrans <- transcan(~ I(age) + sex + pclass + I(sibsp) + I(parch),
                   imputed=TRUE, pl=FALSE, pr=FALSE, data=t3)
summary(xtrans)
transcan(x = ~I(age) + sex + pclass + I(sibsp) + I(parch), imputed = TRUE, 
    pr = FALSE, pl = FALSE, data = t3)

Iterations: 4 

R-squared achieved in predicting each variable:

   age    sex pclass  sibsp  parch 
 0.236  0.075  0.232  0.200  0.173 

Adjusted R-squared:

   age    sex pclass  sibsp  parch 
 0.233  0.072  0.229  0.197  0.170 

Coefficients of canonical variates for predicting each (row) variable

       age   sex   pclass sibsp parch
age           1.33  5.98  -3.16 -0.85
sex     0.04       -0.67  -0.04 -0.80
pclass  0.08 -0.32         0.14  0.02
sibsp  -0.02 -0.01  0.08         0.39
parch   0.00 -0.15  0.01   0.28      

Summary of imputed values

Starting estimates for imputed values:

   age    sex pclass  sibsp  parch 
    28      2      3      0      0 
Code
# Look at mean imputed values by sex,pclass and observed means
# age.i is age, filled in with conditional mean estimates
age.i <- with(t3, impute(xtrans, age, data=t3))
i <- is.imputed(age.i)
with(t3, tapply(age.i[i], list(sex[i],pclass[i]), mean))
            1st      2nd      3rd
female 37.64677 29.78567 21.67031
male   42.21854 32.55474 26.19231
Code
with(t3, tapply(age, list(sex,pclass), mean, na.rm=TRUE))
            1st      2nd      3rd
female 37.03759 27.49919 22.18531
male   41.02925 30.81540 25.96227
Code
dd   <- datadist(dd, age.i)
f.si <- lrm(survived ~ sex * pclass * rcs(age.i, 4) +
            rcs(age.i, 4) * (sibsp + parch), data=t3, x=TRUE, y=TRUE)
print(f.si, coefs=FALSE)

Logistic Regression Model

lrm(formula = survived ~ sex * pclass * rcs(age.i, 4) + rcs(age.i, 
    4) * (sibsp + parch), data = t3, x = TRUE, y = TRUE)
Model Likelihood
Ratio Test
Discrimination
Indexes
Rank Discrim.
Indexes
Obs 1309 LR χ2 649.29 R2 0.532 C 0.864
0 809 d.f. 31 R231,1309 0.376 Dxy 0.715
1 500 Pr(>χ2) <0.0001 R231,927 0.487 γ 0.732
max |∂log L/∂β| 2×10⁻⁸ Brier 0.132 τa 0.344
Code
spar(ps=12)
p1 <- Predict(f1,   age,   pclass, sex, sibsp=0, fun=plogis)
p2 <- Predict(f.si, age.i, pclass, sex, sibsp=0, fun=plogis)
p  <- rbind('Casewise Deletion'=p1, 'Single Imputation'=p2,
            rename=c(age.i='age'))   # creates .set. variable
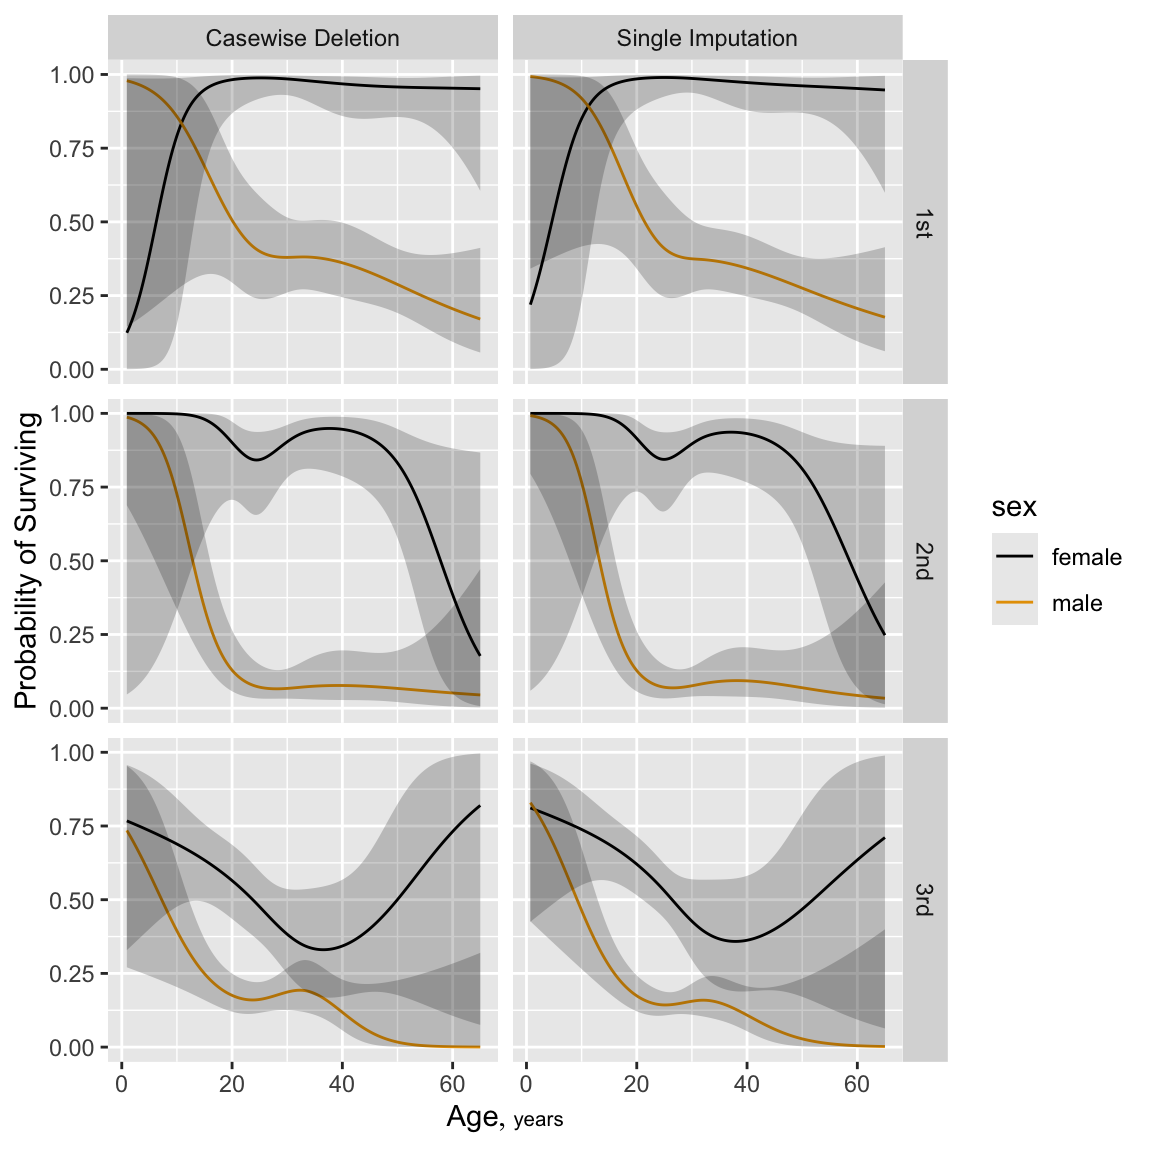
ggplot(p, groups='sex', ylab='Probability of Surviving')
anova(f.si, test='LR')
Likelihood Ratio Statistics for survived
χ2 d.f. P
sex (Factor+Higher Order Factors) 399.94 12 <0.0001
All Interactions 74.26 11 <0.0001
pclass (Factor+Higher Order Factors) 163.16 16 <0.0001
All Interactions 61.31 14 <0.0001
age.i (Factor+Higher Order Factors) 109.88 24 <0.0001
All Interactions 55.34 21 <0.0001
Nonlinear (Factor+Higher Order Factors) 40.70 16 0.0006
sibsp (Factor+Higher Order Factors) 28.84 4 <0.0001
All Interactions 12.81 3 0.0051
parch (Factor+Higher Order Factors) 1.55 4 0.8177
All Interactions 0.26 3 0.9681
sex × pclass (Factor+Higher Order Factors) 50.28 8 <0.0001
sex × age.i (Factor+Higher Order Factors) 19.61 9 0.0205
Nonlinear (Factor+Higher Order Factors) 15.35 6 0.0177
Nonlinear Interaction : f(A,B) vs. AB 8.33 2 0.0156
pclass × age.i (Factor+Higher Order Factors) 23.86 12 0.0213
Nonlinear (Factor+Higher Order Factors) 19.67 8 0.0117
Nonlinear Interaction : f(A,B) vs. AB 11.63 4 0.0203
age.i × sibsp (Factor+Higher Order Factors) 12.81 3 0.0051
Nonlinear 1.50 2 0.4718
Nonlinear Interaction : f(A,B) vs. AB 1.50 2 0.4718
age.i × parch (Factor+Higher Order Factors) 0.26 3 0.9681
Nonlinear 0.02 2 0.9876
Nonlinear Interaction : f(A,B) vs. AB 0.02 2 0.9876
sex × pclass × age.i (Factor+Higher Order Factors) 11.88 6 0.0647
Nonlinear 10.57 4 0.0318
TOTAL NONLINEAR 40.70 16 0.0006
TOTAL INTERACTION 108.27 23 <0.0001
TOTAL NONLINEAR + INTERACTION 117.26 25 <0.0001
TOTAL 649.29 31 <0.0001
Figure 12.9: Predicted probability of survival for males from fit using casewise deletion (bottom) and single conditional mean imputation (top). is set to zero for these predicted values.
Figure 12.10: Predicted probability of survival for males from fit using casewise deletion (bottom) and single conditional mean imputation (top). is set to zero for these predicted values.
D

12.6 Multiple Imputation

The following uses aregImpute with predictive mean matching. By default, aregImpute does not transform age when it is being predicted from the other variables. Four knots are used to transform age when used to impute other variables (not needed here as no other missings were present). Since the fraction of observations with missing age is \(\frac{263}{1309} = 0.2\) we use 20 imputations.

Force sibsp and parch to be linear for imputation, because their highly discrete distributions make it difficult to choose knots for splines.
Code
set.seed(17)         # so can reproduce random aspects
mi <- aregImpute(~ age + sex + pclass +
                 I(sibsp) + I(parch) + survived,
                 data=t3, n.impute=20, nk=4, pr=FALSE)
mi

Multiple Imputation using Bootstrap and PMM

aregImpute(formula = ~age + sex + pclass + I(sibsp) + I(parch) + 
    survived, data = t3, n.impute = 20, nk = 4, pr = FALSE)

n: 1309     p: 6    Imputations: 20     nk: 4 

Number of NAs:
     age      sex   pclass    sibsp    parch survived 
     263        0        0        0        0        0 

         type d.f.
age         s    1
sex         c    1
pclass      c    2
sibsp       l    1
parch       l    1
survived    l    1

Transformation of Target Variables Forced to be Linear

R-squares for Predicting Non-Missing Values for Each Variable
Using Last Imputations of Predictors
  age 
0.294 
Code
# Print the first 10 imputations for the first 10 passengers
#  having missing age
mi$imputed$age[1:10, 1:10]
    [,1] [,2] [,3] [,4] [,5] [,6] [,7] [,8] [,9] [,10]
16    29 71.0   62   41   24   71 48.0   30   28    33
38    42 58.0   58   64   62   28 51.0   36   29    29
41    42 32.5   55   24   58   60 54.0   47   23    54
47    31 28.5   48   37   60   50 28.5   38   42    47
60    28 42.0   38   31   58   21 45.0    2   61    42
70    38 58.0   30   17   43   39 64.0   52   33    30
71    37 46.0   30   47   30   36 47.0   65   30    40
75    62 46.0   47   70   65   54 21.0   47   46    56
81    24 25.0   17   28   36   29 42.0   56   48    41
107   42 23.0   60   41   46   58 21.0   61   33    62

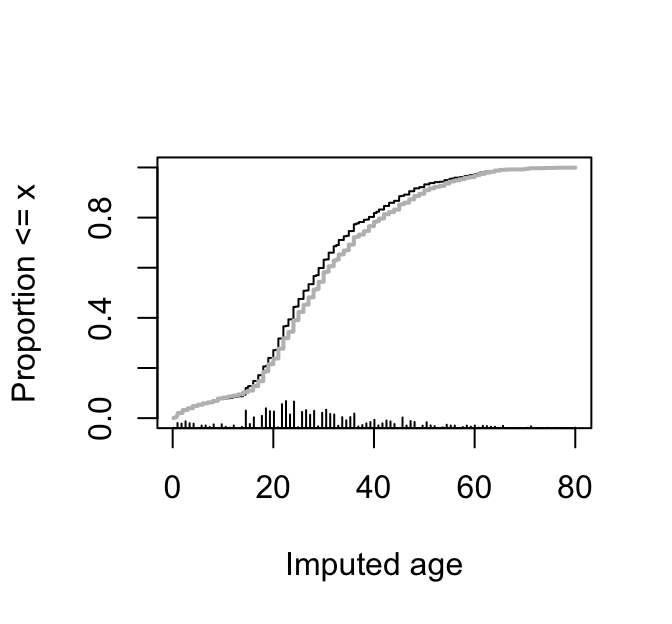
Show the distribution of imputed (black) and actual ages (gray).

E
Code
plot(mi)
Ecdf(t3$age, add=TRUE, col='gray', lwd=2,
     subtitles=FALSE)
Figure 12.11: Distributions of imputed and actual ages for the Titanic dataset. Imputed values are in black and actual ages in gray.
  • Fit logistic models for 20 completed datasets and print the ratio of imputation-corrected variances to average ordinary variances.
  • Use method of Chan & Meng to get LR tests
  • This method takes final \(\hat{\beta}\) from a single model fit on 20 stacked completed datasets
  • But standard errors come from the usual Rubin’s rule and the 20 fits
  • rms::processMI computes the LR statistics from special information saved by fit.mult.impute triggered by lrt=TRUE
  • The Hmisc package runifChanged function is used to save the result and not spend 1m running it again until an input changes
  • The rms LRupdate function is run to fix likelihood ratio-related statistics (LR test, its \(p\)-value, various \(R^2\) measures) using the overall Chan & Meng model LR \(\chi^2\) computed by processMI
  • Two of the \(R^2\) printed use an effective sample size of 927 for the unbalanced binary survived variable
F
Code
runmi <- function()
  fit.mult.impute(survived ~ sex * pclass * rcs(age, 4) + rcs(age, 4) * (sibsp + parch),
                  lrm, mi, data=t3, pr=FALSE, lrt=TRUE)  # lrt implies x=TRUE y=TRUE + more
seed <- 17
f.mi <- runifChanged(runmi, seed, mi, t3)
afmi <- processMI(f.mi, 'anova')
# Print imputation penalty indexes
prmiInfo(afmi)
Imputation penalties
Test Missing
Information
Fraction
Denominator
d.f.
χ2 Discount
sex (Factor+Higher Order Factors) 0.131 13387.9 0.869
All Interactions 0.180 6455.1 0.820
pclass (Factor+Higher Order Factors) 0.106 27217.2 0.894
All Interactions 0.154 11285.5 0.846
age (Factor+Higher Order Factors) 0.179 14281.1 0.821
All Interactions 0.175 12960.7 0.825
Nonlinear (Factor+Higher Order Factors) 0.160 11937.3 0.840
sibsp (Factor+Higher Order Factors) 0.209 1744.4 0.791
All Interactions 0.215 1235.9 0.785
parch (Factor+Higher Order Factors) 0.179 2362.9 0.821
All Interactions 0.219 1183.5 0.781
sex × pclass (Factor+Higher Order Factors) 0.153 6502.3 0.847
sex × age (Factor+Higher Order Factors) 0.210 3875.9 0.790
Nonlinear (Factor+Higher Order Factors) 0.223 2293.9 0.777
Nonlinear Interaction : f(A,B) vs. AB 0.000 Inf 1.000
pclass × age (Factor+Higher Order Factors) 0.169 7940.7 0.831
Nonlinear (Factor+Higher Order Factors) 0.186 4413.0 0.814
Nonlinear Interaction : f(A,B) vs. AB 0.181 2330.0 0.819
age × sibsp (Factor+Higher Order Factors) 0.215 1235.9 0.785
Nonlinear 0.147 1765.7 0.853
Nonlinear Interaction : f(A,B) vs. AB 0.147 1765.7 0.853
age × parch (Factor+Higher Order Factors) 0.219 1183.5 0.781
Nonlinear 0.213 837.2 0.787
Nonlinear Interaction : f(A,B) vs. AB 0.213 837.2 0.787
sex × pclass × age (Factor+Higher Order Factors) 0.215 2476.2 0.785
Nonlinear 0.260 1123.0 0.740
TOTAL NONLINEAR 0.160 11937.3 0.840
TOTAL INTERACTION 0.167 15608.7 0.833
TOTAL NONLINEAR + INTERACTION 0.165 17345.0 0.835
TOTAL 0.144 28342.6 0.856
  • None of the denominator d.f. is small enough for us to worry about the \(\chi^2\) approximation
  • Take the ratio of selected LR statistics after multiple imputation to that from casewise deletion
Code
afmi
Likelihood Ratio Statistics for survived
χ2 d.f. P
sex (Factor+Higher Order Factors) 345.17 12 <0.0001
All Interactions 59.41 11 <0.0001
pclass (Factor+Higher Order Factors) 161.47 16 <0.0001
All Interactions 50.55 14 <0.0001
age (Factor+Higher Order Factors) 101.66 24 <0.0001
All Interactions 43.61 21 0.0026
Nonlinear (Factor+Higher Order Factors) 39.97 16 0.0008
sibsp (Factor+Higher Order Factors) 24.23 4 <0.0001
All Interactions 8.94 3 0.0300
parch (Factor+Higher Order Factors) 3.19 4 0.5272
All Interactions 1.72 3 0.6329
sex × pclass (Factor+Higher Order Factors) 42.26 8 <0.0001
sex × age (Factor+Higher Order Factors) 14.42 9 0.1081
Nonlinear (Factor+Higher Order Factors) 11.47 6 0.0748
Nonlinear Interaction : f(A,B) vs. AB 7.94 2 0.0189
pclass × age (Factor+Higher Order Factors) 19.68 12 0.0734
Nonlinear (Factor+Higher Order Factors) 14.76 8 0.0639
Nonlinear Interaction : f(A,B) vs. AB 8.93 4 0.0629
age × sibsp (Factor+Higher Order Factors) 8.94 3 0.0300
Nonlinear 1.26 2 0.5313
Nonlinear Interaction : f(A,B) vs. AB 1.26 2 0.5313
age × parch (Factor+Higher Order Factors) 1.72 3 0.6329
Nonlinear 1.73 2 0.4214
Nonlinear Interaction : f(A,B) vs. AB 1.73 2 0.4214
sex × pclass × age (Factor+Higher Order Factors) 9.11 6 0.1676
Nonlinear 7.66 4 0.1050
TOTAL NONLINEAR 39.97 16 0.0008
TOTAL INTERACTION 87.90 23 <0.0001
TOTAL NONLINEAR + INTERACTION 100.00 25 <0.0001
TOTAL 567.58 31 <0.0001
Code
f.mi <- LRupdate(f.mi, afmi)
print(f.mi, r2=1:4)   # print all 4 imputation-adjusted R^2

Logistic Regression Model

fit.mult.impute(formula = survived ~ sex * pclass * rcs(age, 
    4) + rcs(age, 4) * (sibsp + parch), fitter = lrm, xtrans = mi, 
    data = t3, lrt = TRUE, pr = FALSE)
Model Likelihood
Ratio Test
Discrimination
Indexes
Rank Discrim.
Indexes
Obs 1309 LR χ2 567.58 R21309 0.352 C 0.868
0 809 d.f. 31 R231,1309 0.336 Dxy 0.731
1 500 Pr(>χ2) <0.0001 R2927 0.458 γ 0.737
max |∂log L/∂β| 3×10⁻⁸ R231,927 0.439 τa 0.347
Brier 0.130
β S.E. Wald Z Pr(>|Z|)
Intercept   -0.3199  3.2655 -0.10 0.9220
sex=male   5.8145  4.1248 1.41 0.1586
pclass=2nd   11.5383  8.2722 1.39 0.1631
pclass=3rd   2.3785  3.1614 0.75 0.4518
age   0.2701  0.2149 1.26 0.2087
age'   -0.6430  0.5367 -1.20 0.2309
age''   2.0278  2.2600 0.90 0.3696
sibsp   -0.7625  0.3165 -2.41 0.0160
parch   -0.4562  0.5576 -0.82 0.4133
sex=male × pclass=2nd  -11.5679  8.8620 -1.31 0.1918
sex=male × pclass=3rd   -6.0402  4.1905 -1.44 0.1495
sex=male × age   -0.5758  0.2578 -2.23 0.0255
sex=male × age'   1.2105  0.6099 1.98 0.0472
sex=male × age''   -3.8105  2.5114 -1.52 0.1292
pclass=2nd × age   -0.8021  0.4775 -1.68 0.0930
pclass=3rd × age   -0.3556  0.2096 -1.70 0.0898
pclass=2nd × age'   1.9084  1.0268 1.86 0.0631
pclass=3rd × age'   0.6770  0.5353 1.26 0.2059
pclass=2nd × age''   -6.6070  4.0714 -1.62 0.1046
pclass=3rd × age''   -1.8293  2.3224 -0.79 0.4309
age × sibsp   0.0070  0.0275 0.26 0.7981
age' × sibsp   0.0987  0.0986 1.00 0.3169
age'' × sibsp   -0.4979  0.5199 -0.96 0.3382
age × parch   0.0362  0.0396 0.91 0.3607
age' × parch   -0.1208  0.1115 -1.08 0.2783
age'' × parch   0.4435  0.5094 0.87 0.3839
sex=male × pclass=2nd × age   0.6870  0.5140 1.34 0.1813
sex=male × pclass=3rd × age   0.4564  0.2625 1.74 0.0821
sex=male × pclass=2nd × age'   -1.6435  1.1151 -1.47 0.1405
sex=male × pclass=3rd × age'   -0.7801  0.6367 -1.23 0.2205
sex=male × pclass=2nd × age''   5.7658  4.4553 1.29 0.1956
sex=male × pclass=3rd × age''   1.7728  2.7888 0.64 0.5250
Code
round(afmi[c(1,3,5,30), 'Chi-Square'] / af1[c(1,3,5,30), 'Chi-Square'], 3)
   sex  (Factor+Higher Order Factors) pclass  (Factor+Higher Order Factors) 
                                1.017                                 1.044 
   age  (Factor+Higher Order Factors)                                 TOTAL 
                                0.932                                 1.010 

G
  • Using all available data resulted in increases in predictive information for sex, pclass and strangely a reduction for age

For each completed dataset run bootstrap validation of model performance indexes and the nonparametric calibration curve. Because the 20 analyses of completed datasets help to average out some of the noise in bootstrap estimates we can use fewer bootstrap repetitions (100) than usual (300 or so).

Code
val <- function(fit)
  list(validate  = validate (fit, B=100),
       calibrate = calibrate(fit, B=100) )

runmi <- function()
  fit.mult.impute(       # 1m
    survived ~ sex * pclass * rcs(age,4) +
    rcs(age,4) * (sibsp + parch),
    lrm, mi, data=t3, pr=FALSE,
    fun=val, fitargs=list(x=TRUE, y=TRUE))
seed <- 19
f <- runifChanged(runmi, seed, mi, t3, val)

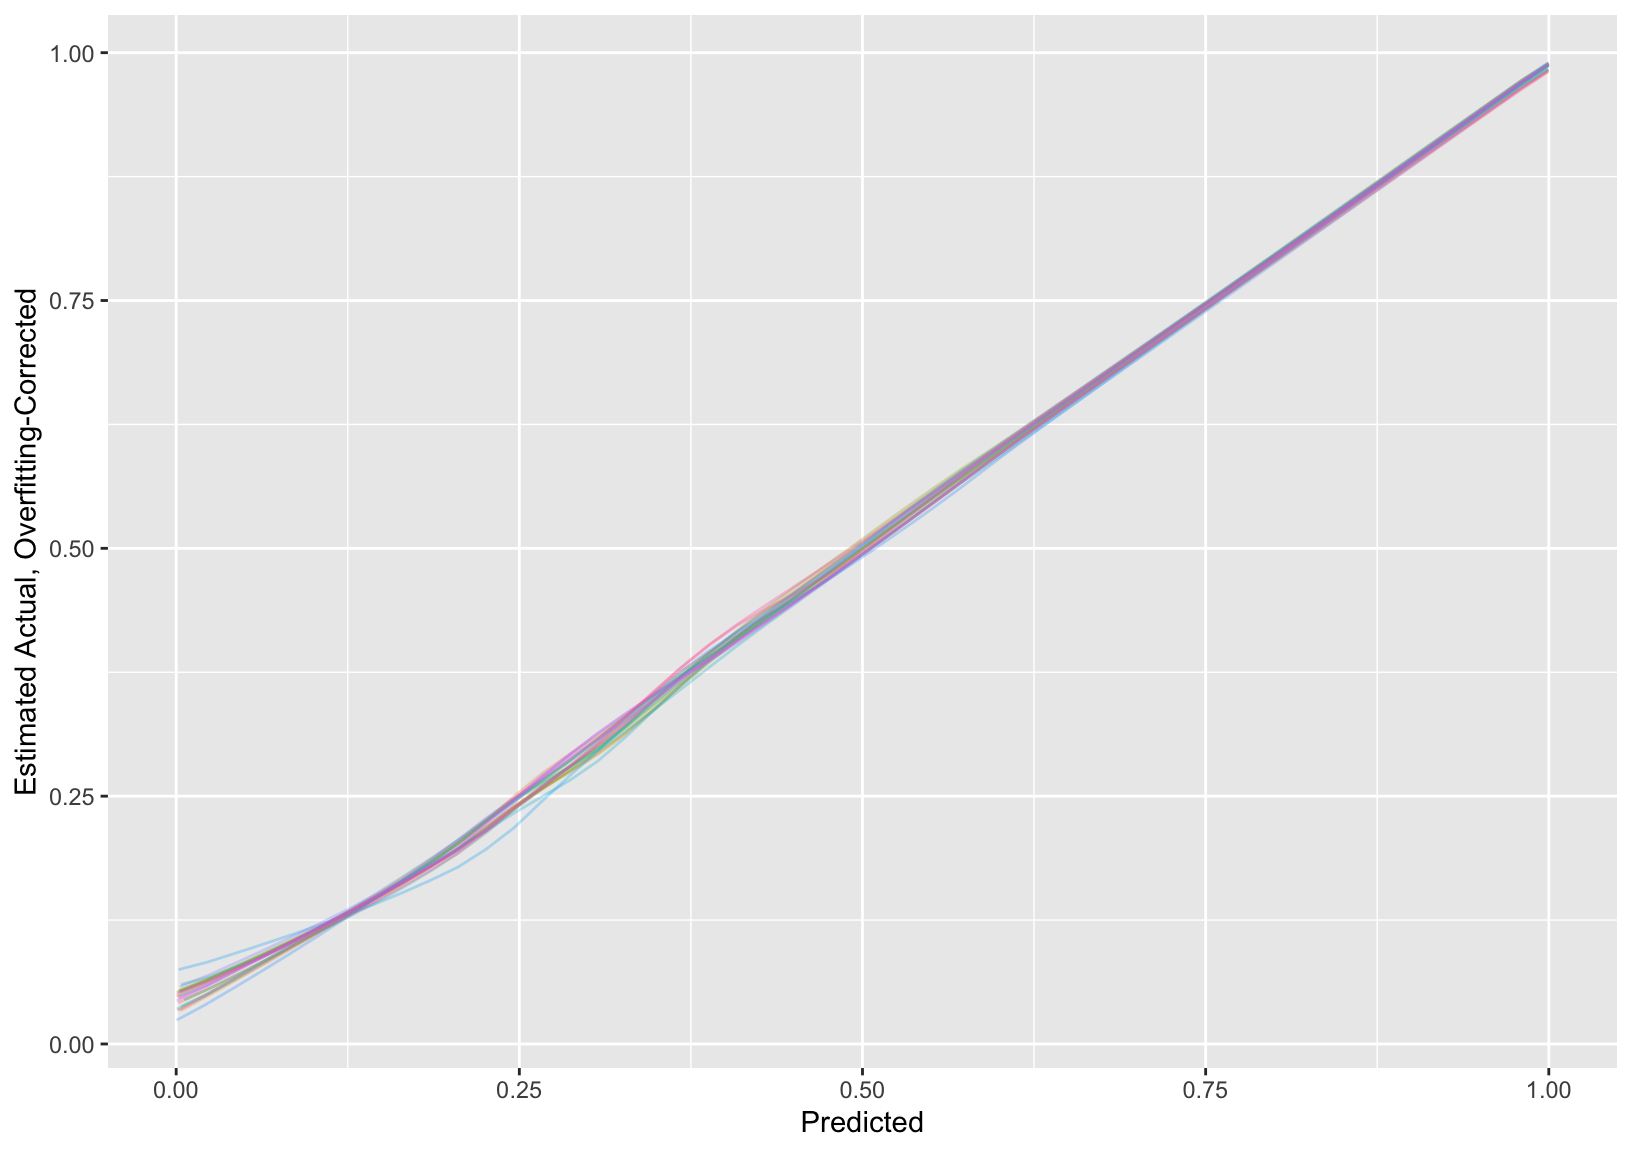
  • Display the 20 bootstrap internal validations averaged over the multiple imputations.
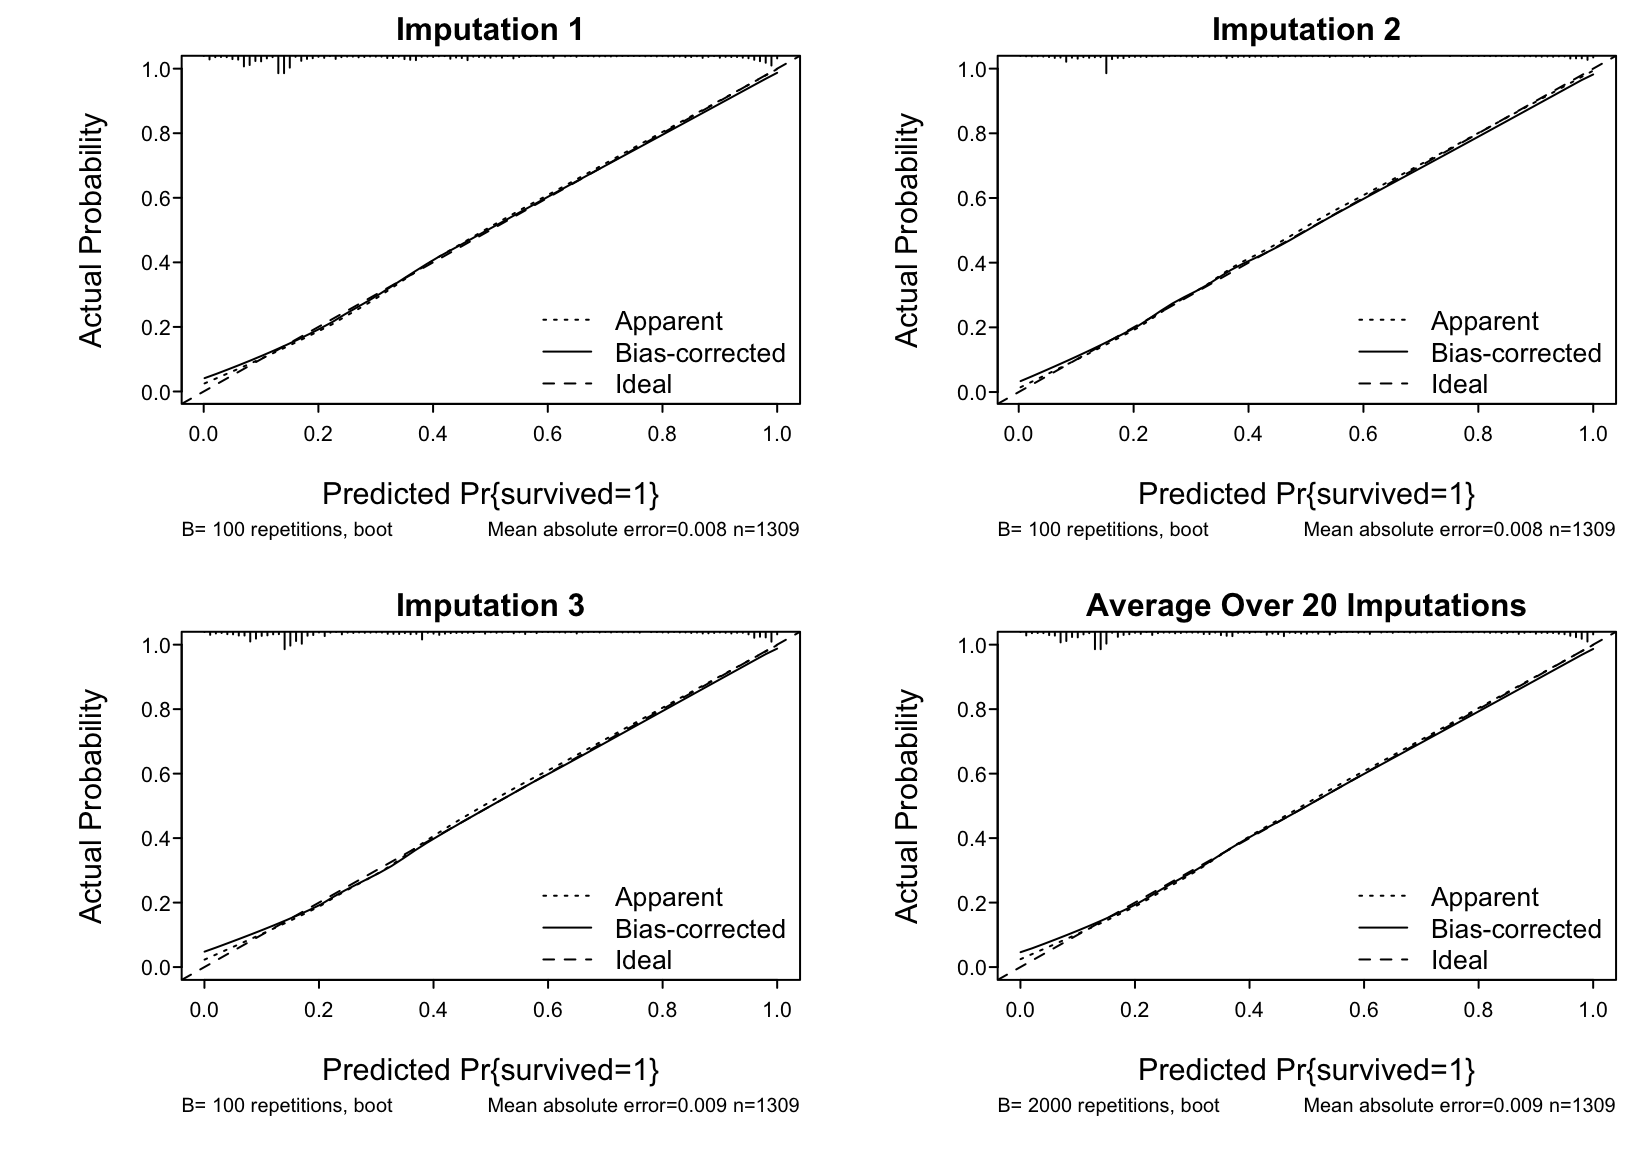
  • Show the 20 individual calibration curves then the first 3 in more detail followed by the overall calibration estimate
Code
val <- processMI(f, 'validate')
print(val, digits=3)
Index Original
Sample
Training
Sample
Test
Sample
Optimism Corrected
Index
Successful
Resamples
Dxy 0.735 0.748 0.724 0.024 0.711 1414
R2 0.543 0.56 0.499 0.06 0.483 1414
Intercept 0 0 -0.093 0.093 -0.093 1414
Slope 1 1 0.85 0.15 0.85 1414
Emax 0 0 0.053 0.053 0.053 1414
D 0.509 0.53 0.458 0.072 0.438 1414
U -0.002 -0.002 Inf -Inf Inf 1414
Q 0.511 0.531 -Inf Inf -Inf 1414
B 0.129 0.126 0.133 -0.007 0.136 1414
g 2.392 3.15 2.605 0.545 1.847 1414
gp 0.352 0.357 0.334 0.023 0.329 1414
Code
spar(mfrow=c(2,2), top=1, bot=2)
cal <- processMI(f, 'calibrate', nind=3)

n=1309   Mean absolute error=0.008   Mean squared error=0.00013
0.9 Quantile of absolute error=0.018

n=1309   Mean absolute error=0.008   Mean squared error=1e-04
0.9 Quantile of absolute error=0.015

n=1309   Mean absolute error=0.009   Mean squared error=0.00017
0.9 Quantile of absolute error=0.022

n=1309   Mean absolute error=0.009   Mean squared error=0.00017
0.9 Quantile of absolute error=0.022
Code
# plot(cal) for full-size final calibration curve
Figure 12.12: Estimated calibration curves for the Titanic risk model, accounting for multiple imputation
Figure 12.13: Estimated calibration curves for the Titanic risk model, accounting for multiple imputation

Return to the stacked fit and compare it to the fit from single imputation

Code
p1 <- Predict(f.si,  age.i, pclass, sex, sibsp=0, fun=plogis)
p2 <- Predict(f.mi,  age,   pclass, sex, sibsp=0, fun=plogis)
p  <- rbind('Single Imputation'=p1, 'Multiple Imputation'=p2,
            rename=c(age.i='age'))
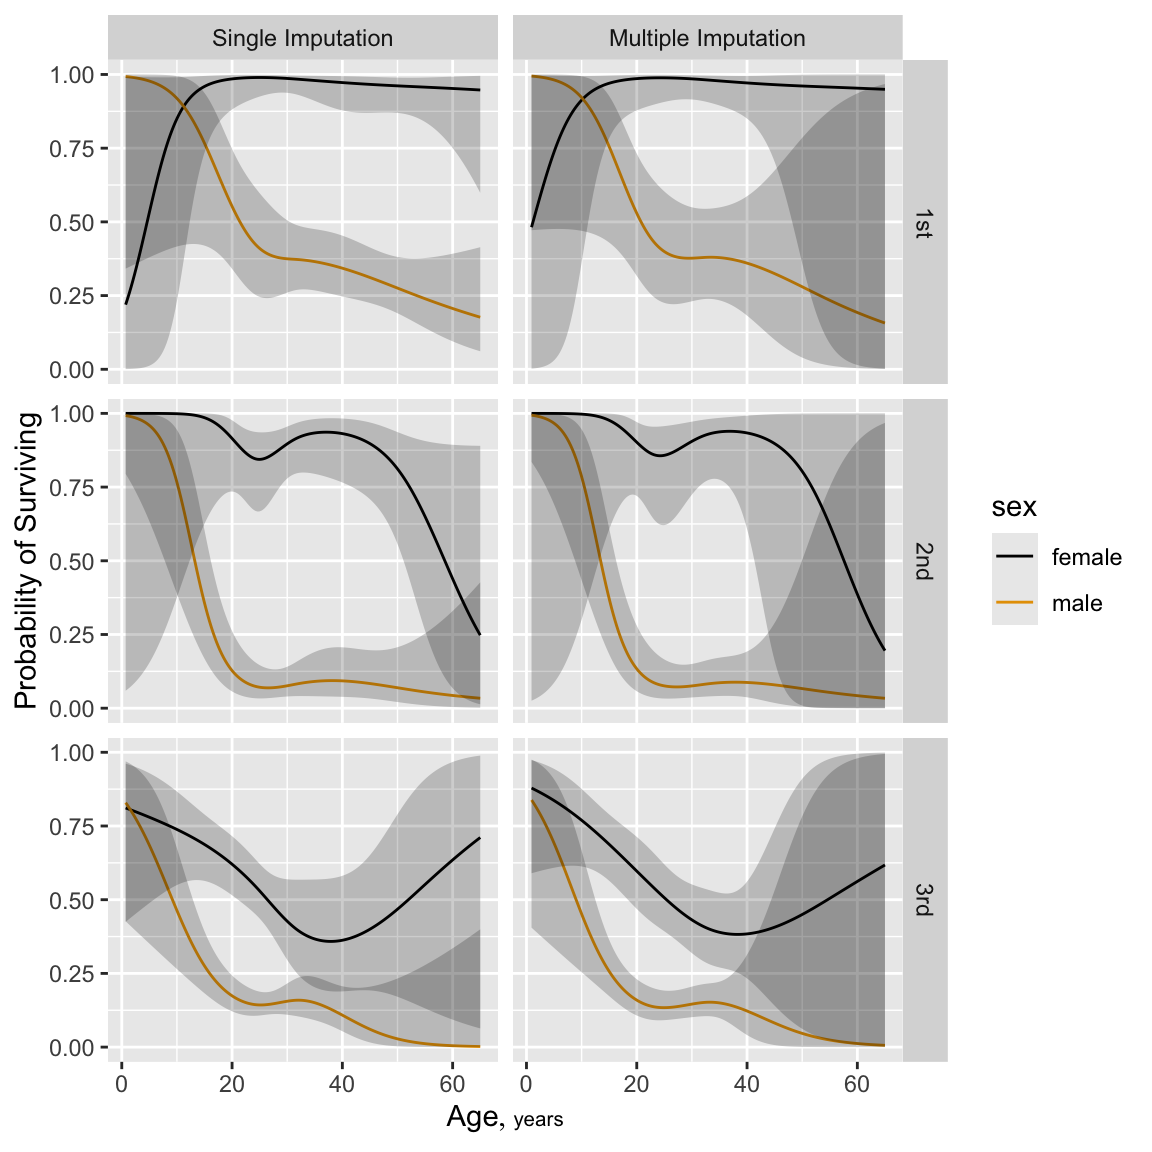
ggplot(p, groups='sex', ylab='Probability of Surviving')
Figure 12.14: Predicted probability of survival for males from fit using single conditional mean imputation again (top) and multiple random draw imputation (bottom). Both sets of predictions are for sibsp=0.

12.7 Summarizing the Fitted Model

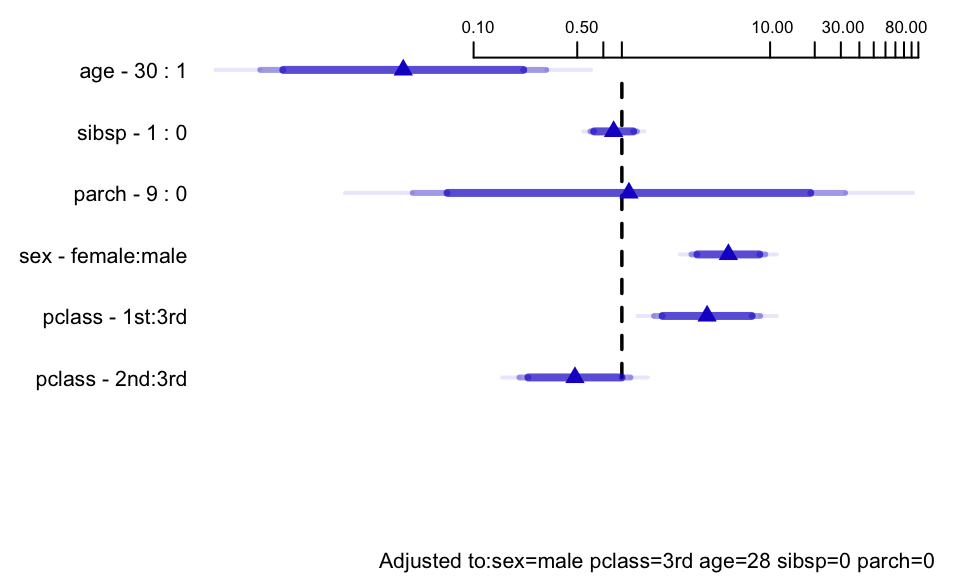
Show odds ratios for changes in predictor values

H
Code
spar(bot=1, top=0.5, ps=8)
# Get predicted values for certain types of passengers
s <- summary(f.mi, age=c(1,30), sibsp=0:1)
# override default ranges for 3 variables
plot(s, log=TRUE, main='')
Figure 12.15: Odds ratios for some predictor settings
Code
phat <- predict(f.mi,
                combos <-
         expand.grid(age=c(2,21,50),sex=levels(t3$sex),
                     pclass=levels(t3$pclass),
                     sibsp=0, parch=0), type='fitted')
# Can also use Predict(f.mi, age=c(2,21,50), sex, pclass,
#                      sibsp=0, fun=plogis)$yhat
options(digits=1)
data.frame(combos, phat)
   age    sex pclass sibsp parch phat
1    2 female    1st     0     0 0.55
2   21 female    1st     0     0 0.99
3   50 female    1st     0     0 0.96
4    2   male    1st     0     0 0.99
5   21   male    1st     0     0 0.49
6   50   male    1st     0     0 0.28
7    2 female    2nd     0     0 1.00
8   21 female    2nd     0     0 0.88
9   50 female    2nd     0     0 0.80
10   2   male    2nd     0     0 0.99
11  21   male    2nd     0     0 0.11
12  50   male    2nd     0     0 0.07
13   2 female    3rd     0     0 0.87
14  21 female    3rd     0     0 0.58
15  50 female    3rd     0     0 0.45
16   2   male    3rd     0     0 0.81
17  21   male    3rd     0     0 0.15
18  50   male    3rd     0     0 0.05
Code
options(digits=5)

We can also get predicted values by creating an R function that will evaluate the model on demand, but that only works if there are no 3rd-order interactions.

I
Code
pred.logit <- Function(f.mi)
# Note: if don't define sibsp to pred.logit, defaults to 0
plogis(pred.logit(age=c(2,21,50), sex='male', pclass='3rd'))

A nomogram could be used to obtain predicted values manually, but this is not feasible when so many interaction terms are present.

J

12.8 Bayesian Analysis

  • Repeat the multiple imputation-based approach but using a Bayesian binary logistic model
  • Using default blrm function normal priors on regression coefficients with zero mean and large SD making the priors almost flat
  • blrm uses the rcmdstan and rstan packages that provides the full power of Stan to R
  • Here we use cmdstan with rcmdstan
  • rmsb has its own caching mechanism that efficiently stores the model fit object (and all its posterior draws) and reads it back from disk install of running it again, until one of the inputs change
  • See this for more about the rmsb package
  • Could use smaller prior SDs to get penalized estimates
  • Using 4 independent Markov chain Hamiltonion posterior sampling procedures each with 1000 burn-in iterations that are discarded, and 1000 “real” iterations for a total of 4000 posterior sample draws
  • Use the first 10 multiple imputations already developed above (object mi), running the Bayesian procedure separately for 10 completed datasets
  • Merely have to stack the posterior draws into one giant sample to account for imputation and get correct posterior distribution
K
Code
# Use all available CPU cores less 1.  Each chain will be run on its
# own core.
require(rmsb)
options(mc.cores=parallel::detectCores() - 1, rmsb.backend='cmdstan')
cmdstanr::set_cmdstan_path(cmdstan.loc)
# cmdstan.loc is defined in ~/.Rprofile

# 10 Bayesian analyses took 3m on 11 cores
set.seed(21)
bt <- stackMI(survived ~ sex * pclass * rcs(age, 4) +
          rcs(age, 4) * (sibsp + parch),
          blrm, mi, data=t3, n.impute=10, refresh=25,
          file='bt.rds')
bt

Bayesian Logistic Model

Dirichlet Priors With Concentration Parameter 0.541 for Intercepts

stackMI(formula = survived ~ sex * pclass * rcs(age, 4) + rcs(age, 
    4) * (sibsp + parch), fitter = blrm, xtrans = mi, data = t3, 
    n.impute = 10, refresh = 25, file = "bt.rds")
Mixed Calibration/
Discrimination Indexes
Discrimination
Indexes
Rank Discrim.
Indexes
Obs 1309 B 0.132 [0.129, 0.134] g 2.791 [2.33, 3.309] C 0.867 [0.862, 0.871]
0 809 gp 0.361 [0.342, 0.376] Dxy 0.734 [0.724, 0.742]
1 500 EV 0.47 [0.43, 0.511]
Draws 40000 v 8.243 [4.111, 13.559]
Chains 4 vp 0.111 [0.101, 0.119]
Time 12.8s
Imputations 10
p 31
Mean β Median β S.E. Lower Upper Pr(β>0) Symmetry
Intercept   -2.9894   -2.0178   5.0835  -13.8933   5.2728  0.3052  0.61
sex=male   9.8314   9.0675   5.7565   -0.2692  21.5774  0.9858  1.49
pclass=2nd   21.5522   20.0700  10.3277   4.0448  41.9855  0.9993  1.49
pclass=3rd   5.4162   4.4455   4.9937   -3.1272  15.7435  0.9071  1.67
age   0.4806   0.4273   0.3339   -0.0865   1.1756  0.9677  1.58
age'   -1.1039   -1.0023   0.7902   -2.7138   0.2984  0.0494  0.70
age''   4.2071   3.8706   3.1940   -1.5000  10.7564  0.9306  1.35
sibsp   -0.9467   -0.9331   0.3217   -1.5715  -0.3170  0.0005  0.88
parch   -0.5083   -0.5833   0.7037   -1.8232   1.1421  0.1632  1.57
sex=male × pclass=2nd  -21.7801  -20.4281  11.0045  -43.4822  -2.0769  0.0043  0.71
sex=male × pclass=3rd   -9.8185   -9.0601   5.8183  -21.9969   0.0662  0.0160  0.68
sex=male × age   -0.8685   -0.8211   0.3657   -1.6058  -0.2170  0.0006  0.68
sex=male × age'   1.8148   1.7241   0.8435   0.3018   3.5228  0.9958  1.36
sex=male × age''   -6.8322   -6.5286   3.3790  -13.6805  -0.6707  0.0089  0.77
pclass=2nd × age   -1.4164   -1.3382   0.5969   -2.6232  -0.3890  0.0002  0.70
pclass=3rd × age   -0.5876   -0.5316   0.3291   -1.2862  -0.0460  0.0077  0.62
pclass=2nd × age'   3.0912   2.9609   1.2646   0.7930   5.6110  0.9994  1.35
pclass=3rd × age'   1.1827   1.0820   0.7849   -0.2117   2.7865  0.9653  1.43
pclass=2nd × age''  -12.1913  -11.7462   4.9344  -22.1308  -3.1604  0.0012  0.78
pclass=3rd × age''   -4.1301   -3.7933   3.2184  -10.7090   1.7068  0.0765  0.76
age × sibsp   0.0171   0.0164   0.0272   -0.0349   0.0712  0.7314  1.04
age' × sibsp   0.0695   0.0694   0.0965   -0.1219   0.2558  0.7629  1.01
age'' × sibsp   -0.4739   -0.4719   0.5155   -1.5094   0.5034  0.1805  0.97
age × parch   0.0414   0.0463   0.0479   -0.0681   0.1296  0.8442  0.67
age' × parch   -0.1314   -0.1398   0.1266   -0.3736   0.1372  0.1393  1.25
age'' × parch   0.5636   0.5863   0.5627   -0.6132   1.6290  0.8484  0.89
sex=male × pclass=2nd × age   1.3069   1.2388   0.6380   0.1650   2.5991  0.9960  1.34
sex=male × pclass=3rd × age   0.7294   0.6837   0.3697   0.0776   1.4880  0.9942  1.45
sex=male × pclass=2nd × age'   -2.8466   -2.7251   1.3599   -5.5994  -0.3345  0.0065  0.79
sex=male × pclass=3rd × age'   -1.3506   -1.2635   0.8598   -3.1331   0.1824  0.0357  0.75
sex=male × pclass=2nd × age''   11.2216   10.8104   5.3367   1.2781  22.1298  0.9915  1.21
sex=male × pclass=3rd × age''   4.0250   3.7650   3.5517   -2.5855  11.2108  0.8844  1.22
  • Note that fit indexes have HPD uncertainty intervals
  • Everthing above accounts for imputation
  • Look at diagnostics
L
Code
stanDx(bt)
Diagnostics for each of 10 imputations

Iterations: 2000 on each of 4 chains, with 4000 posterior distribution samples saved

For each parameter, n_eff is a crude measure of effective sample size
and Rhat is the potential scale reduction factor on split chains
(at convergence, Rhat=1)


Imputation 1 

Checking sampler transitions treedepth.
Treedepth satisfactory for all transitions.

Checking sampler transitions for divergences.
No divergent transitions found.

Checking E-BFMI - sampler transitions HMC potential energy.
E-BFMI satisfactory.

Effective sample size satisfactory.

Split R-hat values satisfactory all parameters.

Processing complete, no problems detected.

EBFMI: 1.047 0.909 1.055 0.945 

   Parameter  Rhat ESS bulk ESS tail
1   alpha[1] 1.000     1130     1220
2    beta[1] 1.000      881     1204
3    beta[2] 1.001      940      980
4    beta[3] 1.000     2105     2305
5    beta[4] 1.000     1178     1376
6    beta[5] 1.001     1049     1125
7    beta[6] 1.001     1451     1565
8    beta[7] 1.001     2250     2566
9    beta[8] 1.000     3309     3030
10   beta[9] 1.001      766      870
11  beta[10] 1.000     1922     1795
12  beta[11] 1.002      922      972
13  beta[12] 1.002     1006     1247
14  beta[13] 1.001     1500     1596
15  beta[14] 1.002      811      829
16  beta[15] 1.002     1699     2204
17  beta[16] 1.001      859      863
18  beta[17] 1.000     2409     2594
19  beta[18] 1.001      940      967
20  beta[19] 1.000     2222     3016
21  beta[20] 1.000     3929     3246
22  beta[21] 1.000     4224     2977
23  beta[22] 1.000     3553     3024
24  beta[23] 1.001     3618     2983
25  beta[24] 1.001     3647     2972
26  beta[25] 1.002     4755     3110
27  beta[26] 1.001      748      833
28  beta[27] 1.000     1445     1630
29  beta[28] 1.002      711      817
30  beta[29] 1.000     1812     2331
31  beta[30] 1.001      830      997
32  beta[31] 1.000     2229     1982

Imputation 2 

Checking sampler transitions treedepth.
Treedepth satisfactory for all transitions.

Checking sampler transitions for divergences.
No divergent transitions found.

Checking E-BFMI - sampler transitions HMC potential energy.
E-BFMI satisfactory.

Effective sample size satisfactory.

Split R-hat values satisfactory all parameters.

Processing complete, no problems detected.

EBFMI: 0.902 1.01 0.982 0.968 

   Parameter  Rhat ESS bulk ESS tail
1   alpha[1] 1.006     1155     1629
2    beta[1] 1.007      927     1429
3    beta[2] 1.008      816     1116
4    beta[3] 1.005     1709     1466
5    beta[4] 1.008      877     1285
6    beta[5] 1.007      953     1246
7    beta[6] 1.007     1180     2030
8    beta[7] 1.001     2062     2300
9    beta[8] 1.001     2479     3038
10   beta[9] 1.007      708     1089
11  beta[10] 1.004     1521     1618
12  beta[11] 1.005      873     1300
13  beta[12] 1.008      868     1234
14  beta[13] 1.007     1217     2166
15  beta[14] 1.007      786     1122
16  beta[15] 1.001     1618     1894
17  beta[16] 1.008      778     1027
18  beta[17] 1.004     2383     2589
19  beta[18] 1.006      957     1420
20  beta[19] 1.003     2114     1990
21  beta[20] 1.000     4710     3098
22  beta[21] 1.000     4618     2978
23  beta[22] 1.000     4589     3039
24  beta[23] 1.001     3765     2678
25  beta[24] 1.001     4172     2807
26  beta[25] 1.002     4011     2677
27  beta[26] 1.009      672      954
28  beta[27] 1.005     1175     1671
29  beta[28] 1.010      683     1075
30  beta[29] 1.002     1986     2612
31  beta[30] 1.009      911     1470
32  beta[31] 1.004     2034     1818

Imputation 3 

Checking sampler transitions treedepth.
Treedepth satisfactory for all transitions.

Checking sampler transitions for divergences.
No divergent transitions found.

Checking E-BFMI - sampler transitions HMC potential energy.
E-BFMI satisfactory.

Effective sample size satisfactory.

Split R-hat values satisfactory all parameters.

Processing complete, no problems detected.

EBFMI: 1.011 1.037 0.947 0.983 

   Parameter  Rhat ESS bulk ESS tail
1   alpha[1] 1.003      951     1719
2    beta[1] 1.003      966     1329
3    beta[2] 1.001      829      807
4    beta[3] 1.000     1851     2070
5    beta[4] 1.002     1001     1740
6    beta[5] 1.003      857     1097
7    beta[6] 1.001     1226     1944
8    beta[7] 1.000     2056     2566
9    beta[8] 1.000     2696     2300
10   beta[9] 1.004      731      813
11  beta[10] 1.003     1815     1974
12  beta[11] 1.002      900     1488
13  beta[12] 1.002     1132     1236
14  beta[13] 1.001     1370     2032
15  beta[14] 1.002      713      851
16  beta[15] 1.002     1127     1295
17  beta[16] 1.001      709      989
18  beta[17] 1.004     1603     1705
19  beta[18] 1.001      836     1105
20  beta[19] 1.002     1643     2109
21  beta[20] 1.001     3684     2815
22  beta[21] 1.002     2876     2507
23  beta[22] 1.001     3420     2883
24  beta[23] 1.001     1834     2393
25  beta[24] 1.002     2566     2595
26  beta[25] 1.000     3421     3159
27  beta[26] 1.004      633      675
28  beta[27] 1.002     1289     1687
29  beta[28] 1.003      619      685
30  beta[29] 1.003     1547     1848
31  beta[30] 1.001      783     1582
32  beta[31] 1.001     2352     2636

Imputation 4 

Checking sampler transitions treedepth.
Treedepth satisfactory for all transitions.

Checking sampler transitions for divergences.
No divergent transitions found.

Checking E-BFMI - sampler transitions HMC potential energy.
E-BFMI satisfactory.

Effective sample size satisfactory.

Split R-hat values satisfactory all parameters.

Processing complete, no problems detected.

EBFMI: 0.955 0.927 0.935 1.069 

   Parameter  Rhat ESS bulk ESS tail
1   alpha[1] 1.007     1016     1551
2    beta[1] 1.006      964     1343
3    beta[2] 1.015      727      826
4    beta[3] 1.003     1631     1583
5    beta[4] 1.007     1016     1279
6    beta[5] 1.008      821     1147
7    beta[6] 1.007     1182     1670
8    beta[7] 1.005     1991     2887
9    beta[8] 1.001     2465     2607
10   beta[9] 1.015      730      802
11  beta[10] 1.002     1499     1669
12  beta[11] 1.010      818      998
13  beta[12] 1.012      797     1028
14  beta[13] 1.006     1366     1556
15  beta[14] 1.011      717      977
16  beta[15] 1.001     1702     2023
17  beta[16] 1.015      633      900
18  beta[17] 1.003     2161     2041
19  beta[18] 1.008      883     1101
20  beta[19] 1.000     1986     2070
21  beta[20] 1.000     3202     2907
22  beta[21] 1.000     3296     2939
23  beta[22] 1.001     2880     2842
24  beta[23] 1.001     2920     2829
25  beta[24] 1.003     3023     2844
26  beta[25] 1.002     3334     2770
27  beta[26] 1.017      581      836
28  beta[27] 1.005     1084     1823
29  beta[28] 1.012      659      846
30  beta[29] 1.001     2105     2537
31  beta[30] 1.014      660     1009
32  beta[31] 1.002     2409     2259

Imputation 5 

Checking sampler transitions treedepth.
Treedepth satisfactory for all transitions.

Checking sampler transitions for divergences.
No divergent transitions found.

Checking E-BFMI - sampler transitions HMC potential energy.
E-BFMI satisfactory.

Effective sample size satisfactory.

Split R-hat values satisfactory all parameters.

Processing complete, no problems detected.

EBFMI: 1.036 1.013 1.039 1.008 

   Parameter  Rhat ESS bulk ESS tail
1   alpha[1] 1.005      898     1572
2    beta[1] 1.006      972     1516
3    beta[2] 1.007      879      722
4    beta[3] 1.001     2207     2166
5    beta[4] 1.005     1067     1281
6    beta[5] 1.005      787      739
7    beta[6] 1.003     1329     1625
8    beta[7] 1.002     1685     2087
9    beta[8] 1.000     3862     3110
10   beta[9] 1.007      682      667
11  beta[10] 1.001     2155     2556
12  beta[11] 1.006      887      936
13  beta[12] 1.006      986     1040
14  beta[13] 1.004     1345     1792
15  beta[14] 1.008      712      726
16  beta[15] 1.001     1506     2559
17  beta[16] 1.008      703      851
18  beta[17] 1.000     2177     2329
19  beta[18] 1.008      835     1142
20  beta[19] 1.001     2349     2526
21  beta[20] 1.000     3914     3170
22  beta[21] 1.000     3394     2795
23  beta[22] 1.001     3626     2855
24  beta[23] 1.001     3371     2808
25  beta[24] 1.001     4580     3274
26  beta[25] 1.001     3810     2683
27  beta[26] 1.007      599      565
28  beta[27] 1.003     1387     2395
29  beta[28] 1.008      621      720
30  beta[29] 1.002     1983     2357
31  beta[30] 1.009      716      852
32  beta[31] 1.001     2446     2239

Imputation 6 

Checking sampler transitions treedepth.
Treedepth satisfactory for all transitions.

Checking sampler transitions for divergences.
No divergent transitions found.

Checking E-BFMI - sampler transitions HMC potential energy.
E-BFMI satisfactory.

Effective sample size satisfactory.

Split R-hat values satisfactory all parameters.

Processing complete, no problems detected.

EBFMI: 0.965 1.073 0.983 0.984 

   Parameter  Rhat ESS bulk ESS tail
1   alpha[1] 1.003      806     1356
2    beta[1] 1.003      620      914
3    beta[2] 1.006      591      875
4    beta[3] 1.002     1564     1493
5    beta[4] 1.004      633      887
6    beta[5] 1.004      674     1044
7    beta[6] 1.002      929     1548
8    beta[7] 1.001     1548     2638
9    beta[8] 1.000     3403     3019
10   beta[9] 1.007      539      859
11  beta[10] 1.000     1500     1369
12  beta[11] 1.005      640      856
13  beta[12] 1.004      684      975
14  beta[13] 1.004     1181     1706
15  beta[14] 1.004      550      757
16  beta[15] 1.002     1073     1668
17  beta[16] 1.005      506      866
18  beta[17] 1.000     1976     2579
19  beta[18] 1.005      661      991
20  beta[19] 1.001     1967     1794
21  beta[20] 1.000     3637     2677
22  beta[21] 1.001     3436     2763
23  beta[22] 1.001     3423     2794
24  beta[23] 1.000     3429     2716
25  beta[24] 1.001     4221     3352
26  beta[25] 1.001     4587     2755
27  beta[26] 1.005      516      770
28  beta[27] 1.003      829      902
29  beta[28] 1.005      524      783
30  beta[29] 1.002     1320     2040
31  beta[30] 1.005      593      915
32  beta[31] 1.001     2022     1738

Imputation 7 

Checking sampler transitions treedepth.
Treedepth satisfactory for all transitions.

Checking sampler transitions for divergences.
No divergent transitions found.

Checking E-BFMI - sampler transitions HMC potential energy.
E-BFMI satisfactory.

Effective sample size satisfactory.

Split R-hat values satisfactory all parameters.

Processing complete, no problems detected.

EBFMI: 0.966 0.987 1.021 1.047 

   Parameter  Rhat ESS bulk ESS tail
1   alpha[1] 1.002     1140     1409
2    beta[1] 1.003      940     1533
3    beta[2] 1.003      846      925
4    beta[3] 1.001     1920     2189
5    beta[4] 1.002     1098     1769
6    beta[5] 1.003     1039     1065
7    beta[6] 1.003     1200     1911
8    beta[7] 1.001     1690     2148
9    beta[8] 1.000     4149     2700
10   beta[9] 1.004      783      780
11  beta[10] 1.000     1665     1827
12  beta[11] 1.002     1005     1182
13  beta[12] 1.002      969     1219
14  beta[13] 1.002     1134     1233
15  beta[14] 1.006      750      890
16  beta[15] 1.000     1716     2192
17  beta[16] 1.005      738      818
18  beta[17] 1.000     2202     2352
19  beta[18] 1.005     1099     1220
20  beta[19] 1.001     1922     2197
21  beta[20] 1.002     4777     3105
22  beta[21] 1.000     4178     3115
23  beta[22] 1.000     5601     3201
24  beta[23] 1.001     3782     2934
25  beta[24] 1.000     5424     2986
26  beta[25] 1.000     4489     3265
27  beta[26] 1.004      653      723
28  beta[27] 1.002     1365     1694
29  beta[28] 1.004      686      755
30  beta[29] 1.001     2031     2494
31  beta[30] 1.003      865      966
32  beta[31] 1.000     2312     2184

Imputation 8 

Checking sampler transitions treedepth.
Treedepth satisfactory for all transitions.

Checking sampler transitions for divergences.
No divergent transitions found.

Checking E-BFMI - sampler transitions HMC potential energy.
E-BFMI satisfactory.

Effective sample size satisfactory.

Split R-hat values satisfactory all parameters.

Processing complete, no problems detected.

EBFMI: 0.948 1.003 0.926 1.038 

   Parameter  Rhat ESS bulk ESS tail
1   alpha[1] 1.001     1278     1900
2    beta[1] 1.005      929     1588
3    beta[2] 1.001      863     1214
4    beta[3] 1.002     2265     2222
5    beta[4] 1.003     1056     1387
6    beta[5] 1.001      973     1453
7    beta[6] 1.001     1076     1795
8    beta[7] 1.001     2246     2653
9    beta[8] 1.002     3906     2674
10   beta[9] 1.002      770     1067
11  beta[10] 1.002     2086     2113
12  beta[11] 1.002      965     1296
13  beta[12] 1.002     1039     1238
14  beta[13] 1.003     1182     2123
15  beta[14] 1.002      784     1168
16  beta[15] 1.001     1847     2181
17  beta[16] 1.003      766     1012
18  beta[17] 1.001     2967     2923
19  beta[18] 1.001      934     1437
20  beta[19] 1.001     2488     2454
21  beta[20] 1.002     4201     2656
22  beta[21] 1.001     4553     2946
23  beta[22] 1.001     4304     3273
24  beta[23] 1.001     3420     2713
25  beta[24] 1.001     4534     3133
26  beta[25] 1.000     4633     2845
27  beta[26] 1.003      727      927
28  beta[27] 1.000     1370     1778
29  beta[28] 1.003      710      997
30  beta[29] 1.001     2026     2705
31  beta[30] 1.002      827     1175
32  beta[31] 1.003     2065     2479

Imputation 9 

Checking sampler transitions treedepth.
Treedepth satisfactory for all transitions.

Checking sampler transitions for divergences.
No divergent transitions found.

Checking E-BFMI - sampler transitions HMC potential energy.
E-BFMI satisfactory.

Effective sample size satisfactory.

Split R-hat values satisfactory all parameters.

Processing complete, no problems detected.

EBFMI: 0.932 0.961 1.005 0.941 

   Parameter  Rhat ESS bulk ESS tail
1   alpha[1] 1.008     1004     1491
2    beta[1] 1.004      950     1150
3    beta[2] 1.001      954     1022
4    beta[3] 1.002     1936     2623
5    beta[4] 1.001     1150     1528
6    beta[5] 1.004      971     1248
7    beta[6] 1.001     1259     2000
8    beta[7] 1.001     1771     1988
9    beta[8] 1.001     2922     2606
10   beta[9] 1.002      781      932
11  beta[10] 1.007     1791     2384
12  beta[11] 1.006      865      962
13  beta[12] 1.001     1029     1200
14  beta[13] 1.000     1460     1770
15  beta[14] 1.005      782      980
16  beta[15] 1.007     1231     1751
17  beta[16] 1.002      865      986
18  beta[17] 1.004     1591     2067
19  beta[18] 1.005      955     1158
20  beta[19] 1.000     1902     2233
21  beta[20] 1.001     3825     2995
22  beta[21] 1.001     4095     2815
23  beta[22] 1.001     4216     2575
24  beta[23] 1.001     2666     2701
25  beta[24] 1.000     4343     3324
26  beta[25] 1.001     4384     2842
27  beta[26] 1.003      774      884
28  beta[27] 1.001     1339     1933
29  beta[28] 1.004      729      813
30  beta[29] 1.002     1627     2195
31  beta[30] 1.003      914     1116
32  beta[31] 1.003     2118     1933

Imputation 10 

Checking sampler transitions treedepth.
Treedepth satisfactory for all transitions.

Checking sampler transitions for divergences.
No divergent transitions found.

Checking E-BFMI - sampler transitions HMC potential energy.
E-BFMI satisfactory.

Effective sample size satisfactory.

Split R-hat values satisfactory all parameters.

Processing complete, no problems detected.

EBFMI: 0.882 1.024 0.954 1.092 

   Parameter  Rhat ESS bulk ESS tail
1   alpha[1] 1.005     1103     1564
2    beta[1] 1.006     1001     1229
3    beta[2] 1.008      746      898
4    beta[3] 1.002     1963     2188
5    beta[4] 1.006      935     1181
6    beta[5] 1.008      742      848
7    beta[6] 1.003     1485     1451
8    beta[7] 1.001     2396     2548
9    beta[8] 1.001     3435     3055
10   beta[9] 1.011      677      811
11  beta[10] 1.002     1757     1732
12  beta[11] 1.006      778     1023
13  beta[12] 1.011      623      904
14  beta[13] 1.001     1527     1961
15  beta[14] 1.007      722      983
16  beta[15] 1.004     1658     2069
17  beta[16] 1.009      617      847
18  beta[17] 1.003     2470     2786
19  beta[18] 1.005      911      981
20  beta[19] 1.000     2435     2474
21  beta[20] 1.000     3957     2878
22  beta[21] 1.000     5979     3021
23  beta[22] 1.001     4632     2828
24  beta[23] 1.000     3484     2716
25  beta[24] 1.001     4575     2805
26  beta[25] 1.001     3525     3015
27  beta[26] 1.013      596      650
28  beta[27] 1.006     1201     1560
29  beta[28] 1.009      673      768
30  beta[29] 1.004     1656     2387
31  beta[30] 1.009      806      846
32  beta[31] 1.001     2289     2406
Code
# Look at convergence of only 2 parameters
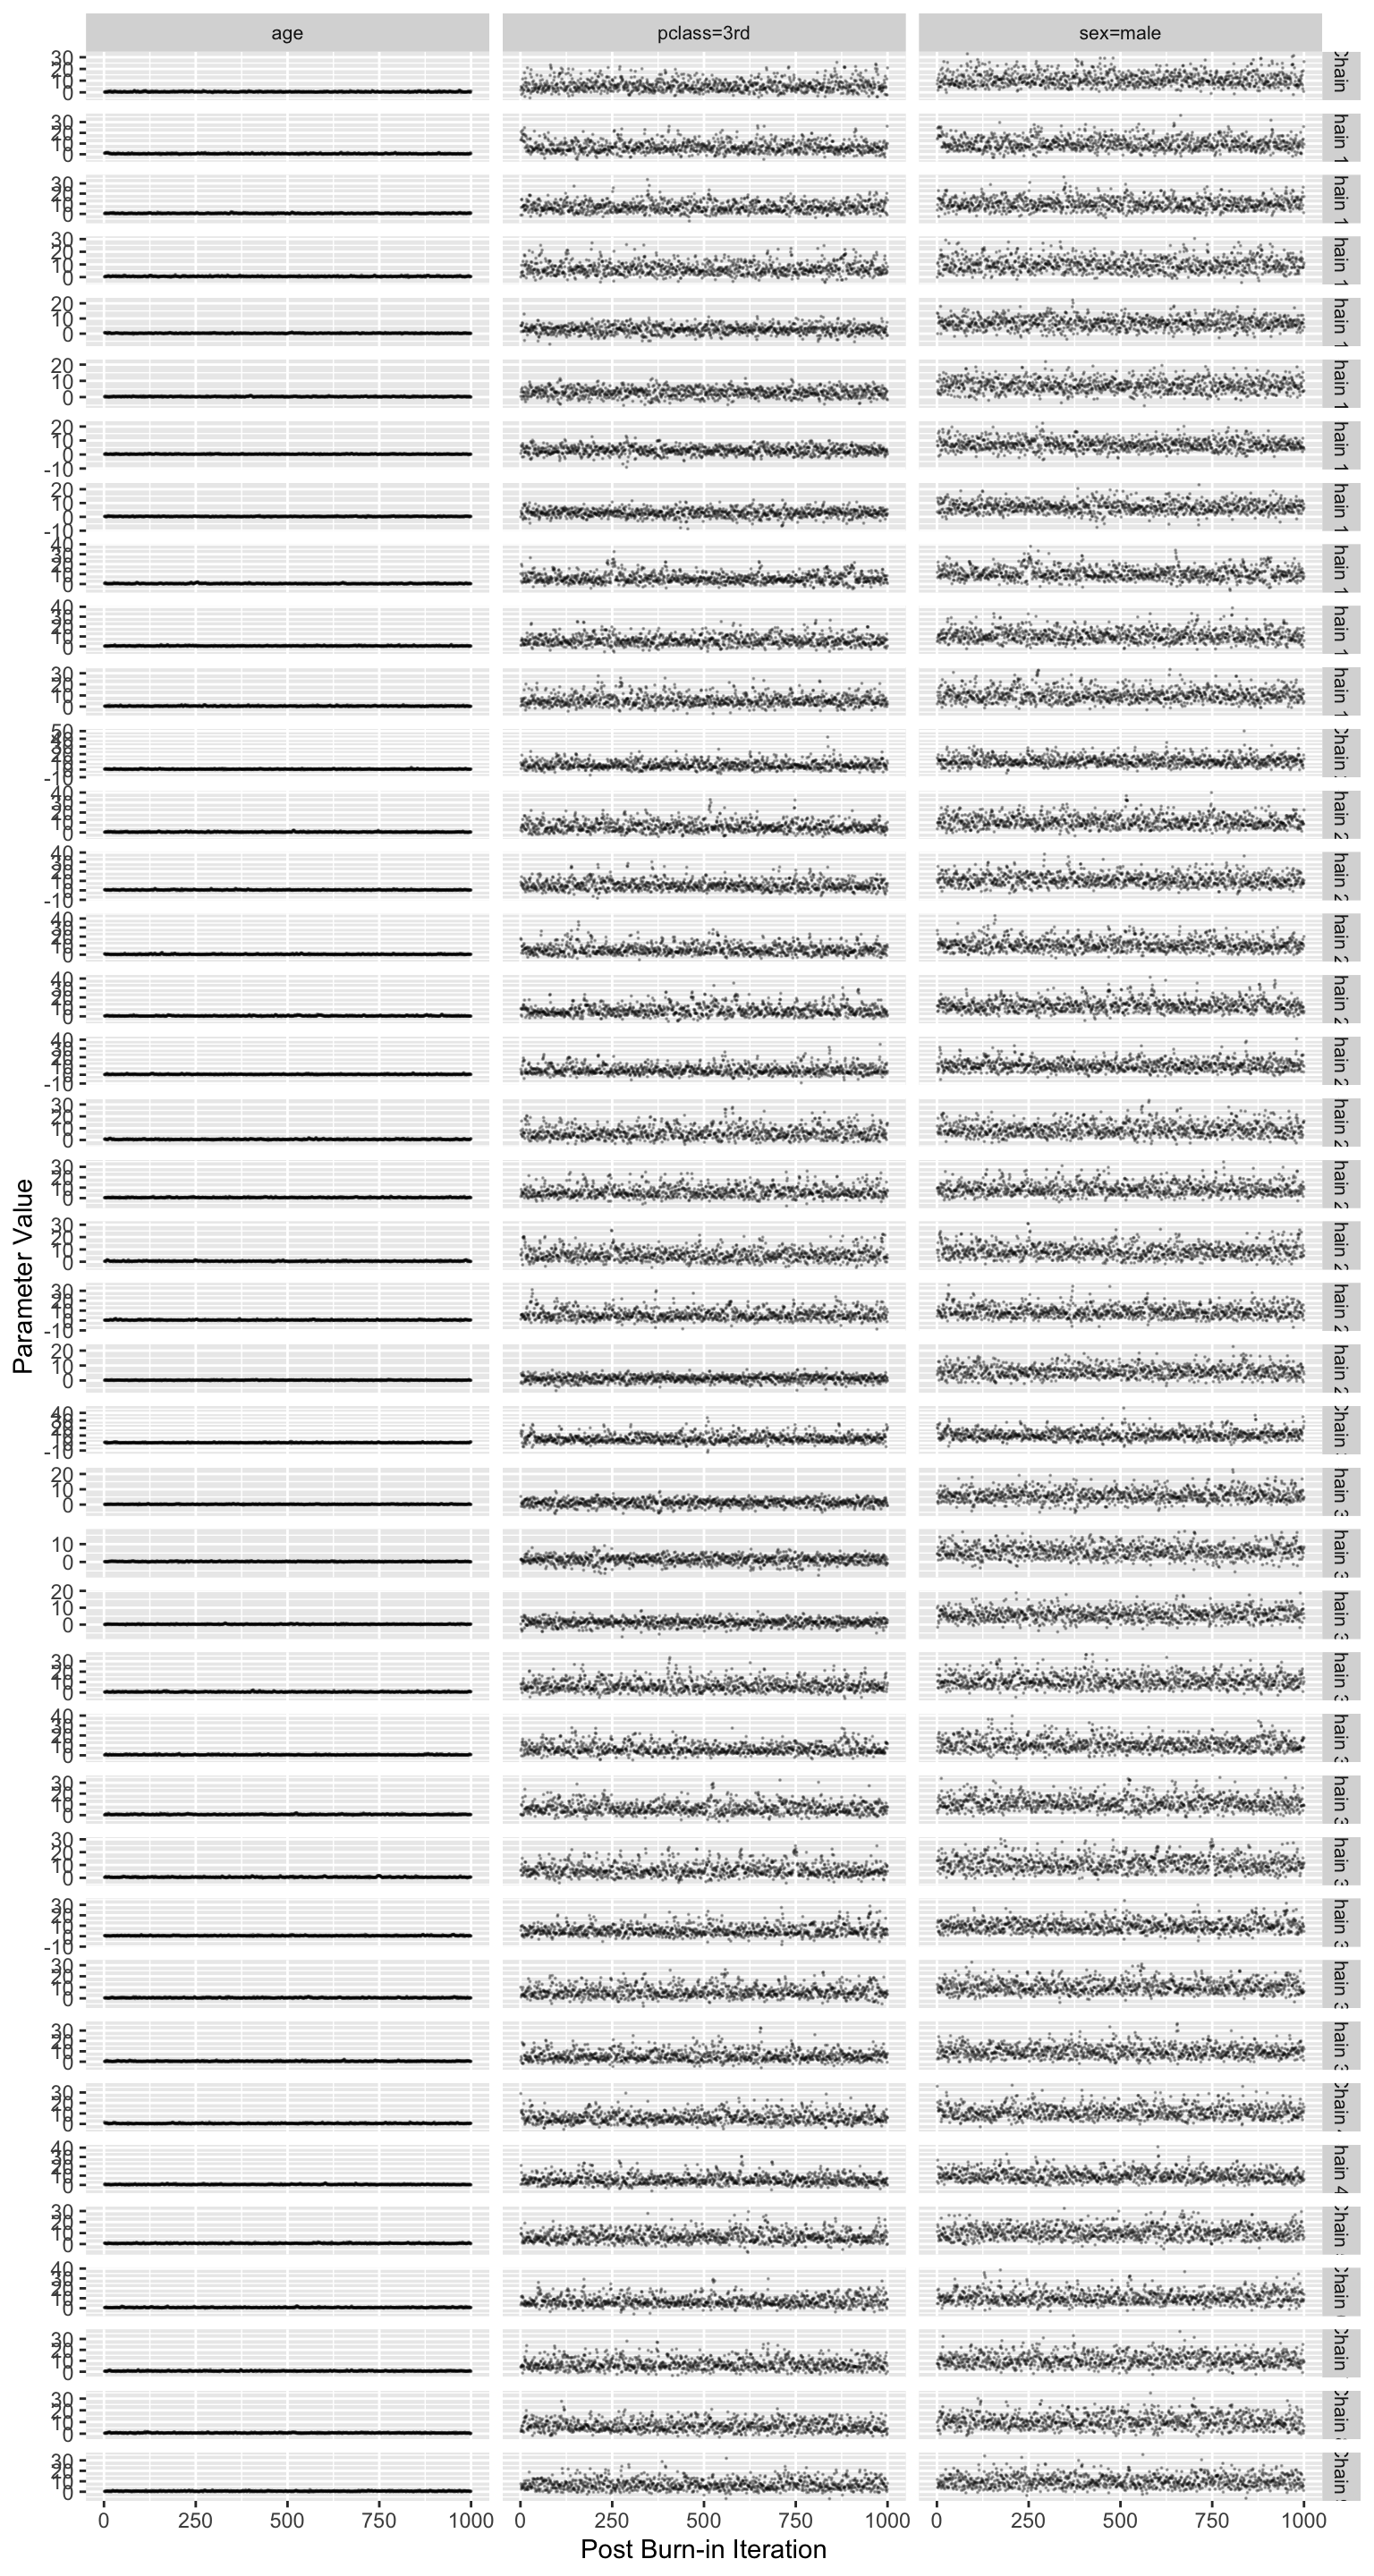
stanDxplot(bt, c('sex=male', 'pclass=3rd', 'age'), rev=TRUE)

  • Difficult to see but there are 40 traces (10 imputations \(\times\) 4 chains)
  • Diagnostics look good; posterior samples can be trusted
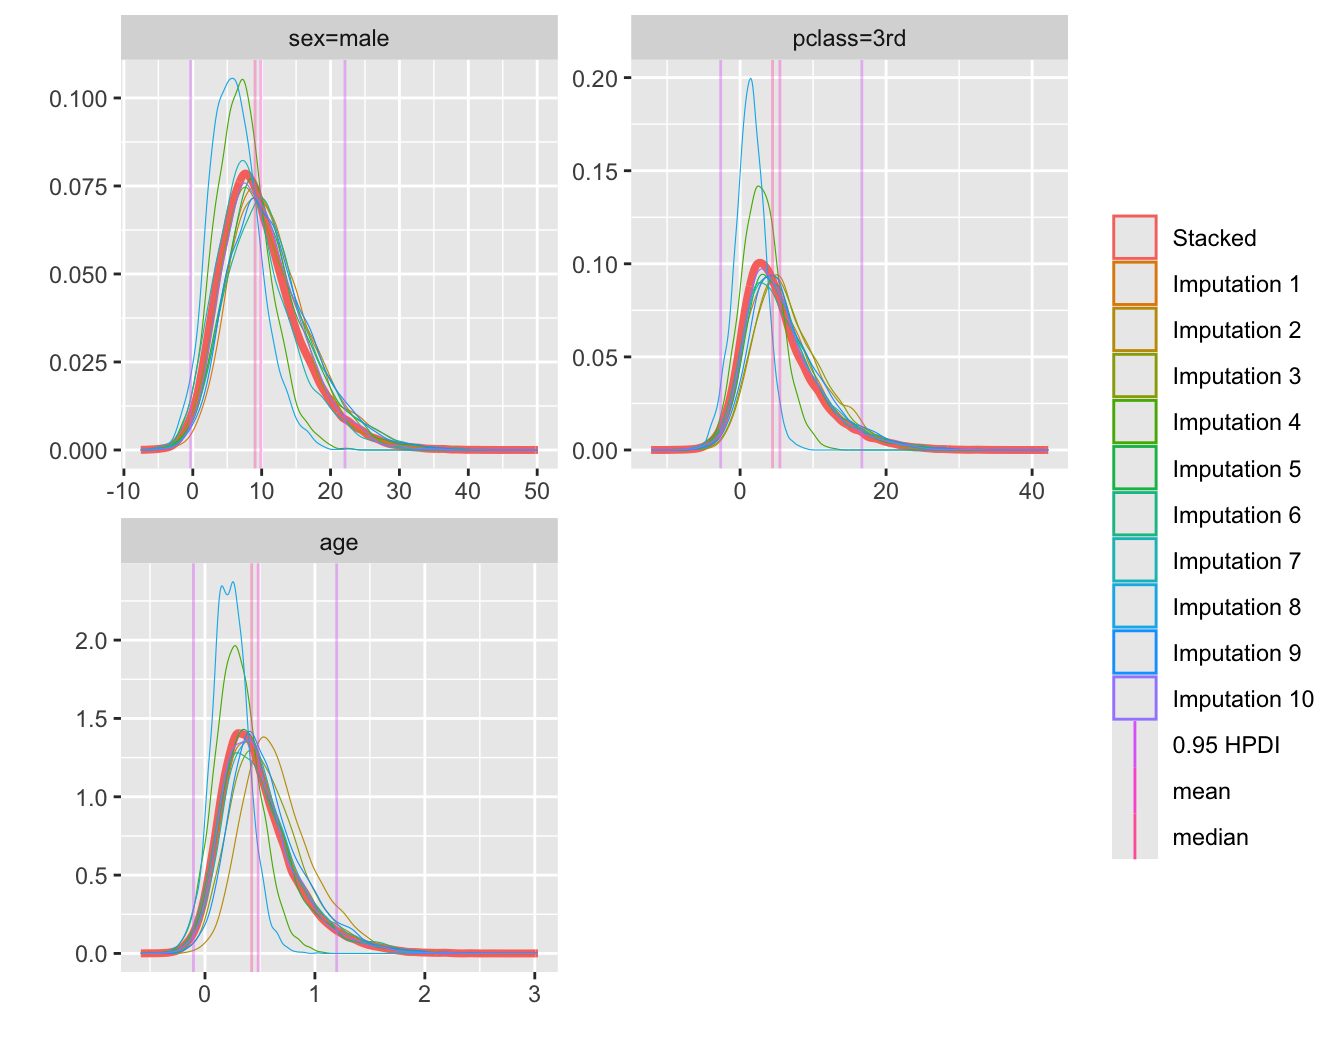
  • Plot posterior densities for select parameters
  • Also shows the 10 densities before stacking
M
Code
plot(bt, c('sex=male', 'pclass=3rd', 'age'), nrow=2)

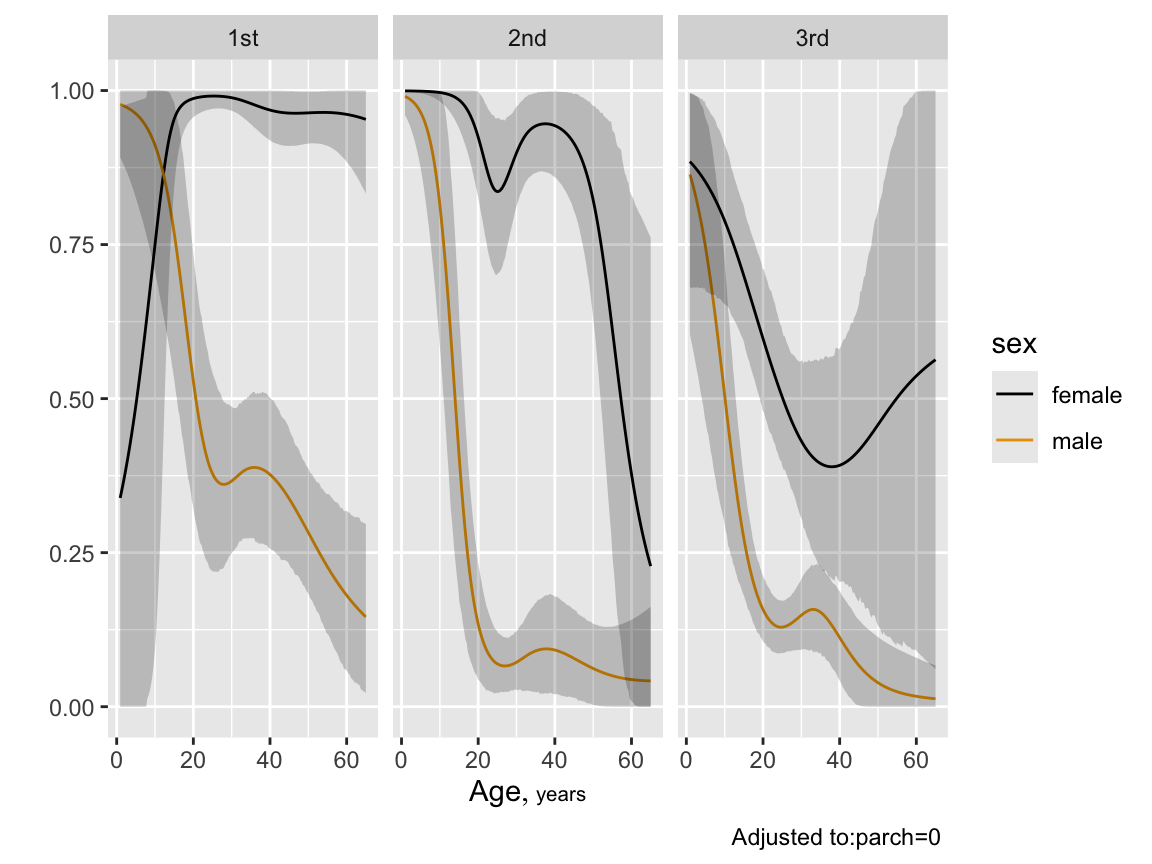
  • Plot partial effect plots with 0.95 highest posterior density intervals
N
Code
p <- Predict(bt, age, sex, pclass, sibsp=0, fun=plogis, funint=FALSE)
ggplot(p)

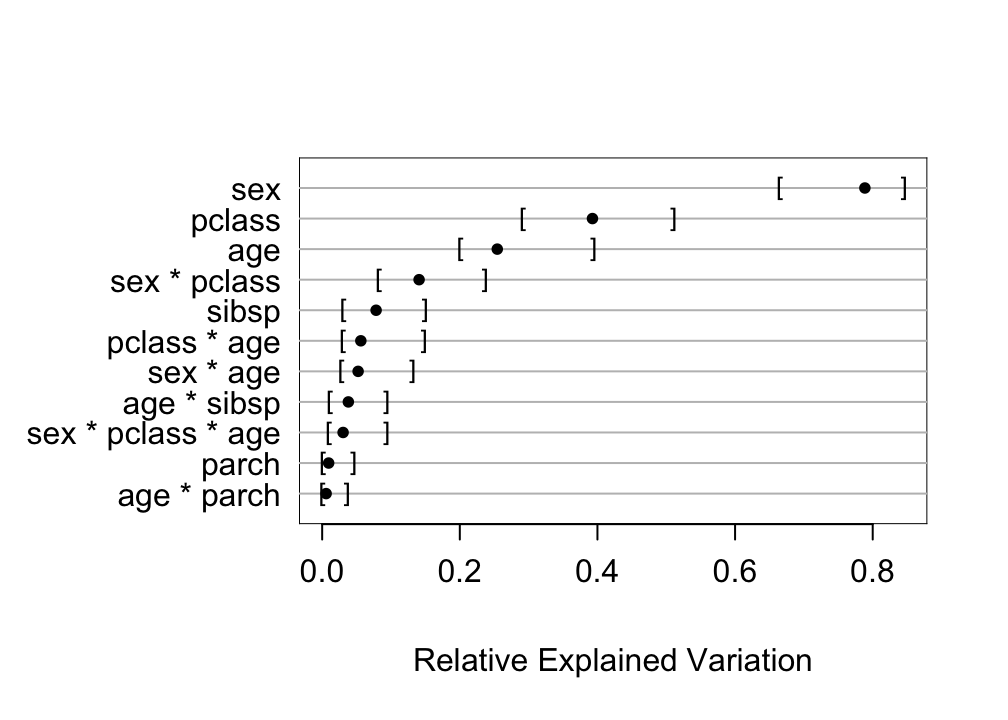
  • Compute approximate measure of explained outcome variation for predictors
O
Code
plot(anova(bt))

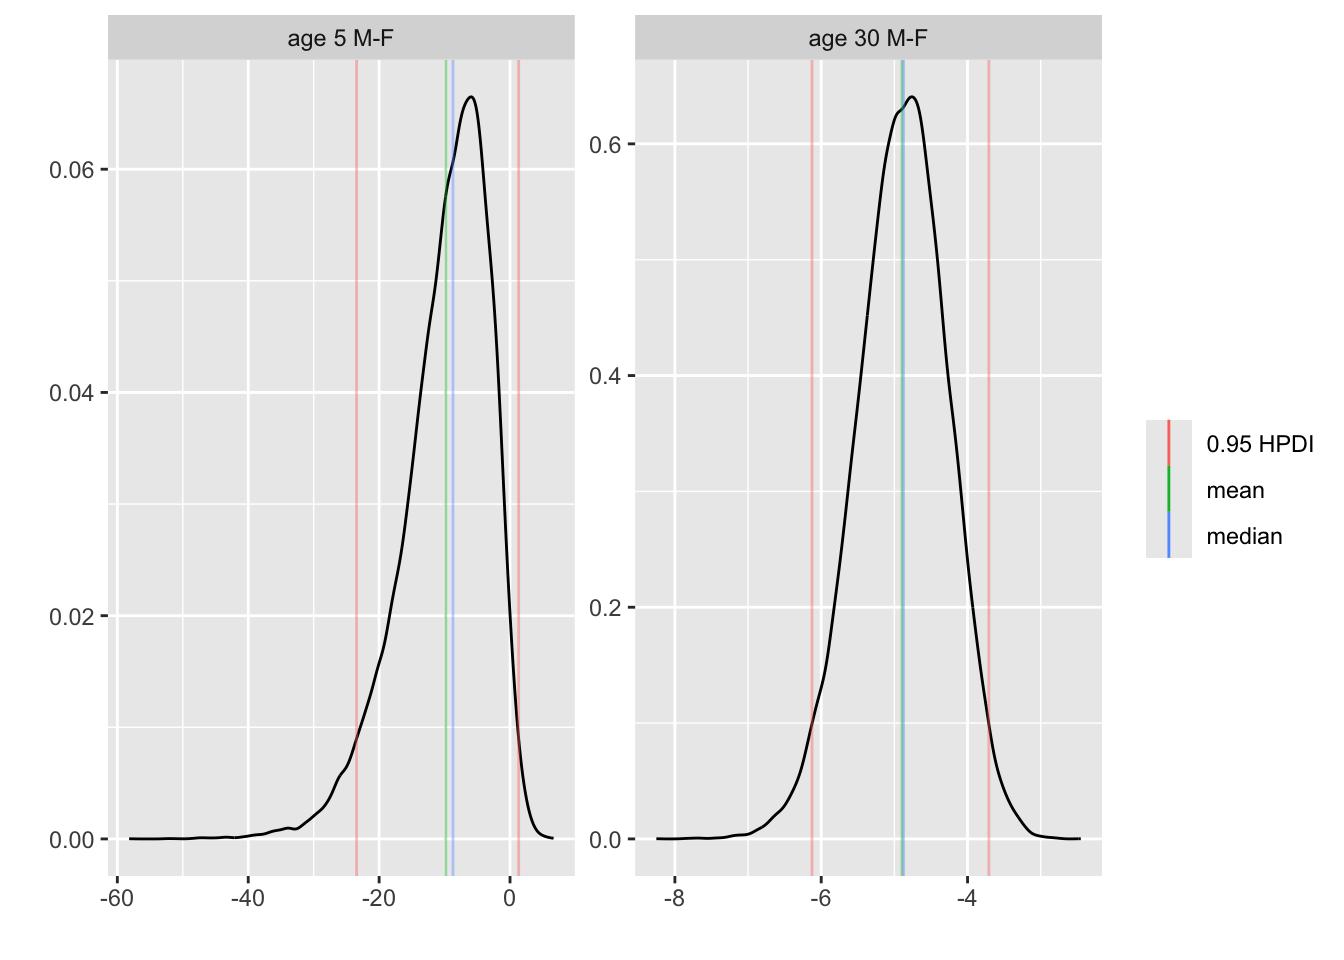
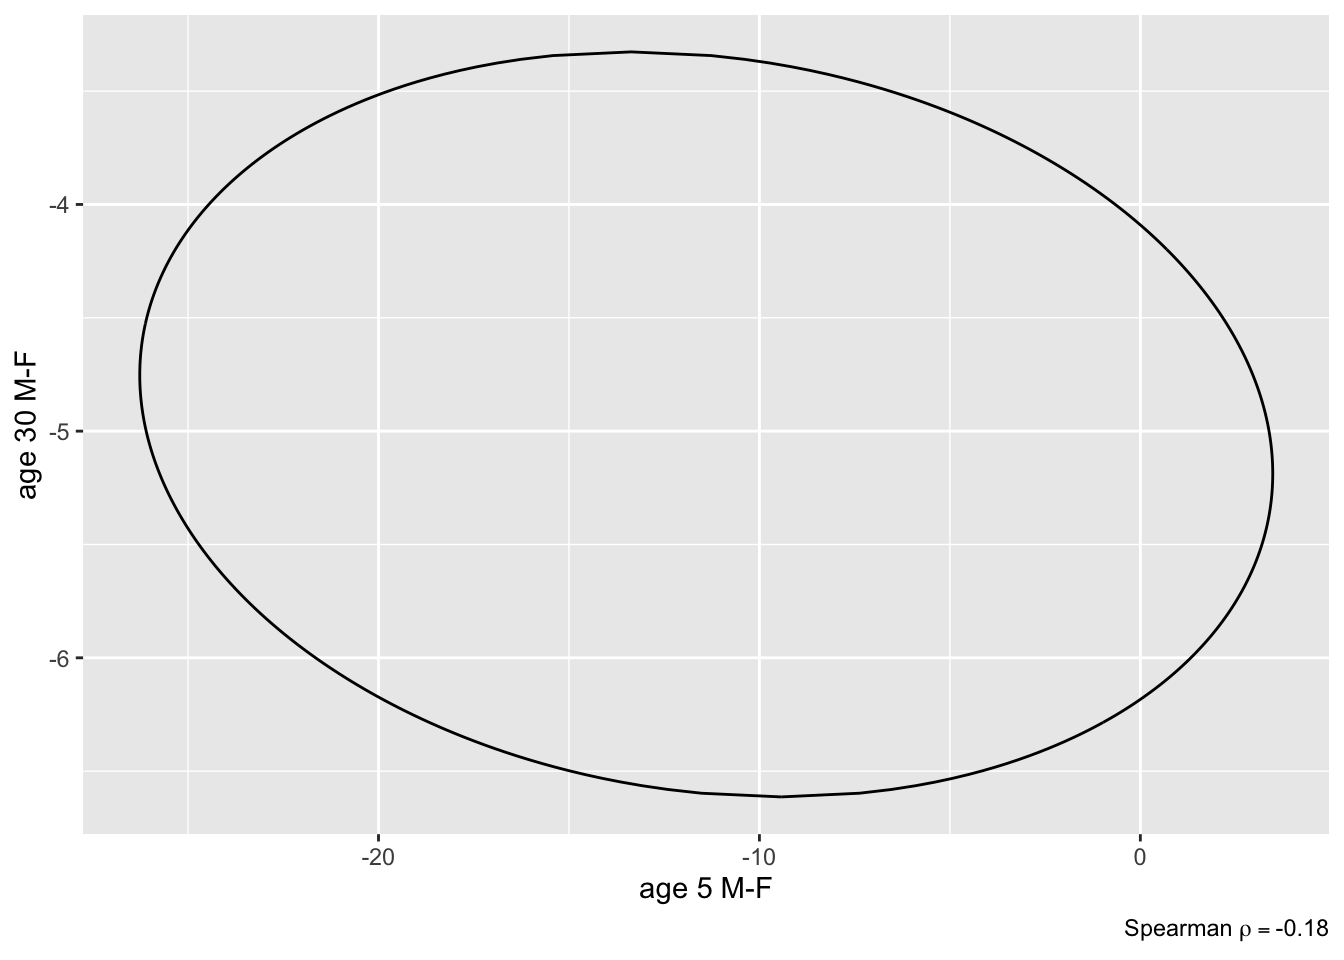
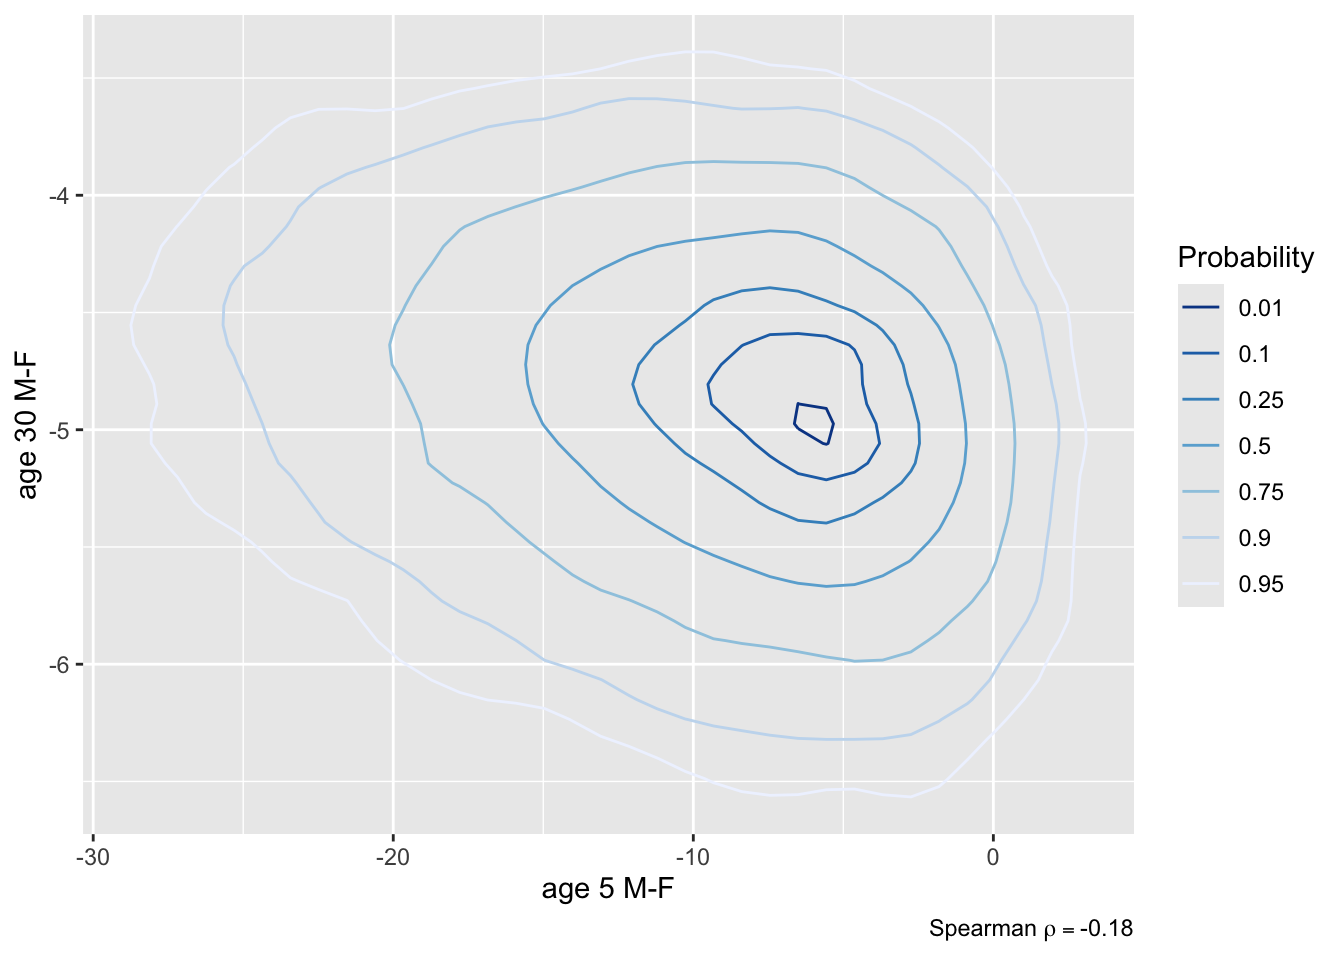
  • Contrast second class males and females, both at 5 years and 30 years of age, all other things being equal
  • Compute 0.95 HPD interval for the contrast and a joint uncertainty region
  • Compute P(both contrasts < 0), both < -2, and P(either one < 0)
P
Code
k <- contrast(bt, list(sex='male',   age=c(5, 30), pclass='2nd'),
                  list(sex='female', age=c(5, 30), pclass='2nd'),
              cnames = c('age 5 M-F', 'age 30 M-F'))
k
            age Contrast    S.E.    Lower   Upper Pr(Contrast>0)
1age 5 M-F    5  -9.7568 6.71540 -23.5524  1.2064         0.0265
2age 30 M-F  30  -4.8965 0.62159  -6.1626 -3.7314         0.0000

Intervals are 0.95 highest posterior density intervals
Contrast is the posterior mean 
Code
plot(k)

Code
plot(k, bivar=TRUE)                        # assumes an ellipse
plot(k, bivar=TRUE, bivarmethod='kernel')  # doesn't
P <- PostF(k, pr=TRUE)
Contrast names: age 5 M-F, age 30 M-F 
Code
P(`age 5 M-F` <  0 & `age 30 M-F` <  0)    # note backticks
[1] 0.97355
Code
P(`age 5 M-F` < -2 & `age 30 M-F` < -2)
[1] 0.9093
Code
P(`age 5 M-F` <  0 | `age 30 M-F` <  0)
[1] 1

  • Show posterior distribution of predicted survival probability for a 21 year old male in third class with sibsp=0
  • Predict summarizes with a posterior mean (set posterior.summary='median' to use posterior median)
  • Frequentist multiple imputation estimate was 0.1342
Code
pmean <- Predict(bt, age=21, sex='male', pclass='3rd', sibsp=0, parch=0,
                 fun=plogis, funint=FALSE)
pmean
  age  sex pclass sibsp parch    yhat    lower   upper
1  21 male    3rd     0     0 0.14626 0.098018 0.19764

Response variable (y):  

Limits are 0.95 confidence limits
Code
p <- predict(bt,
             data.frame(age=21, sex='male', pclass='3rd', sibsp=0, parch=0),
             posterior.summary='all', fun=plogis, funint=FALSE)
plot(density(p), main='',
     xlab='Pr(survival) For One Covariate Combination')
abline(v=with(pmean, c(yhat, lower, upper)), col=alpha('blue', 0.5))

  • Compute Pr(survival probability > 0.2) for this man
Code
mean(p > 0.2)
[1] 0.025225
R software used
Package Purpose Functions
Hmisc Miscellaneous functions summary,plsmo,naclus,llist,latex, summarize,Dotplot,describe
Hmisc Imputation transcan,impute,fit.mult.impute,aregImpute,stackMI
rms Modeling datadist,lrm,rcs
Accounting for imputation processMI, LRupdate
Model presentation plot,summary,nomogram,Function,anova
Estimation Predict,summary,contrast
Model validation validate,calibrate
rmsb Misc. Bayesian blrm, stanDx,stanDxplot,plot
rpart1 Recursive partitioning rpart

1 Written by Atkinson and Therneau